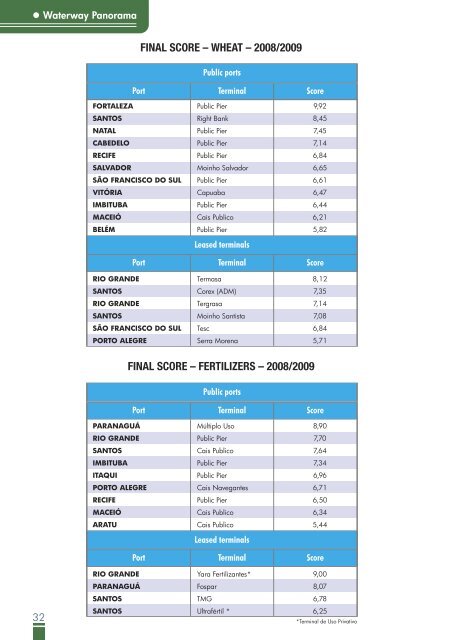
l <strong>Waterway</strong> <strong>Panorama</strong> FINAL SCORE – WHEAT – 2008/2009 Public ports Port Terminal Score FORTALEZA SANTOS NATAL CABEDELO RECIFE SALVADOR SÃO FRANCISCO DO SUL VITÓRIA IMBITUBA MACEIÓ BELÉM Public Pier Right Bank Public Pier Public Pier Public Pier Moinho Salvador Public Pier Capuaba Public Pier Cais Publico Public Pier Leased terminals 9,92 8,45 7,45 7,14 6,84 6,65 6,61 6,47 6,44 6,21 5,82 Port Terminal Score RIO GRANDE SANTOS RIO GRANDE SANTOS SÃO FRANCISCO DO SUL PORTO ALEGRE Termasa Corex (ADM) Tergrasa Moinho Santista Tesc Serra Morena 8,12 7,35 7,14 7,08 6,84 5,71 FINAL SCORE – FERTILIZERS – 2008/2009 Public ports Port Terminal Score PARANAGUÁ RIO GRANDE SANTOS IMBITUBA ITAQUI PORTO ALEGRE RECIFE MACEIÓ ARATU Múltiplo Uso Public Pier Cais Publico Public Pier Public Pier Cais Navegantes Public Pier Cais Publico Cais Publico Leased terminals 8,90 7,70 7,64 7,34 6,96 6,71 6,50 6,34 5,44 Port Terminal Score RIO GRANDE Yara Fertilizantes* 9,00 PARANAGUÁ Fospar 8,07 SANTOS TMG 6,78 32 SANTOS Ultrafértil * 6,25 *Terminal de Uso Privativo
Total cargo handling at private ports and terminals In the first half of 2009, Brazilian ports handled a total 335,924,894 tonnes, with a decrease of 1.7% over the same period last year, when the national volume was 341,664,477 tonnes. In 2008, total handling was 768,323,550 tonnes, with an increase of 1.8% in relation to 2007, when it reached 754,716,655 tonnes. In the five-year series, there was an increase of 23.7%. By nature of the cargo, bulk solid handling was 3.5% lower in the first half of 2009 compared to the same period last year, falling from 201,159,709 tonnes (58.8%) to 194,015,929 tonnes (57.7% of the total volume ). In 2008, the bulk solid handling was 460,187,652 tonnes (59.9% of the total volume), remaining stable in relation to the previous year. In the five-year series, bulk solid handling rose 24.5%. Bulk liquid handling was 3.2% higher in the first half of 2009 over the same period last year, rising from 92,282,654 tonnes (27% of the total volume) to 95,234,730 tonnes (28.3% of the total volume). In 2008, bulk liquid handling was 195,637,355 tonnes (25.4% of the total volume), remaining stable in relation to 2007. In the five-year series, bulk liquid handling rose 17.4%. General cargo handling had an increase of 1.1% in the first half of 2009 over the same period last year, rising from 16,899,556 tonnes (5% of the total volume) to 17,092,302 tonnes (5% of the total volume). In 2008, general cargo handling was 39,250,312 tonnes (5.1% of the total volume), with an increase of 12.9% over the previous year. In the five-year series, general cargo handling rose 15.2%. Container handling had a decrease of 5.8% in the first half of 2009, compared to the first quarter of 2008, falling from 31,322,558 tonnes (9.1% of the total volume) to 29,581,933 tonnes (8.8% of the total volume). In 2008, container handling was 73,248,231 tonnes (9.5% of the total volume), with an increase of 7.8% over 2007. In the five-year series, container handling rose 45.1%. By type of shipping, long-haul handling had a decrease of 4.7% in relation to first half of 2008 and 2009, falling from 254,607,463 tonnes (74.5% of the total volume) to 242,541,731 tonnes (72.2% of the total volume). In 2008, the long-haul handling was 568,404,889 tonnes (74% of the total volume), with an increase of 1.67% compared to 2007. In the five-year series, there was an increase of 27.1%. Cabotage handling had an increase of 6.5% between the first half of 2008 and 2009, rising from 74,894,198 tonnes (21.9% of the total volume) to 79,798,581 tonnes (23.7% of the total volume). In 2008, cabotage handling was 167,342,279 tonnes (21.8% of the total movement), virtually unchanged compared with 2007. In the five-year series, there was an increase of 12.7%. Other types of navigation had handlings 11.7% higher in the first half of 2009 over the same period last year, with an increase from 12,162,817 tonnes (3.5% of the total volume) to 13,584,582 tonnes (4% of the total volume). In 2008, other types of navigation totaled 32,576,382 tonnes (4.2% of the total volume), with an increase of 19.7% over 2007. In the five-year series, there was an increase of 29.4%. In relation to foreign trade, long-haul cargo handling was divided as follows: a) 45,814,690 tonnes (18.8% of the total volume) imported in the first half of 2009, against 55,798,341 tonnes (21.9% of the total volume) in the same period of 2008, with a decrease of 17.9%; and b) 196,727,041 tonnes (81.2% of the total volume) exported in the first half of 2009, compared with 198,809,121 tonne (78.1% of the total volume) in the same period of 2008, with a decrease of 1%. In 2008, imports reported 114,696,055 tonnes (20.1% of the total volume), being stable compared to 2007. In the five-year series, imports rose 20%. Exports, in turn, reported 454,629,292 tonnes (79.9% of the total volume) in 2008 compared to 447,837,373 tonnes (80.1%) in 2007, with an increase of 1.5% in the period. In the five-year series, exports rose 29.3%. 33