

Top Down Strategy and Large Cap Stock Picks - the DBS Vickers ...
Top Down Strategy and Large Cap Stock Picks - the DBS Vickers ...
Top Down Strategy and Large Cap Stock Picks - the DBS Vickers ...

Create successful ePaper yourself
Turn your PDF publications into a flip-book with our unique Google optimized e-Paper software.
Regional Equity <strong>Strategy</strong> Q4 2007<br />
<strong>Strategy</strong> Overview: Asian Equity<br />
Asia's exposure to <strong>the</strong> US<br />
The uncertainty surrounding US economic growth also makes us cautious about markets<br />
with a higher degree of US exposure. Asia's growth integration with China is one of <strong>the</strong><br />
reasons for Asia's resilience against a slowing US economy in <strong>the</strong> last two years.<br />
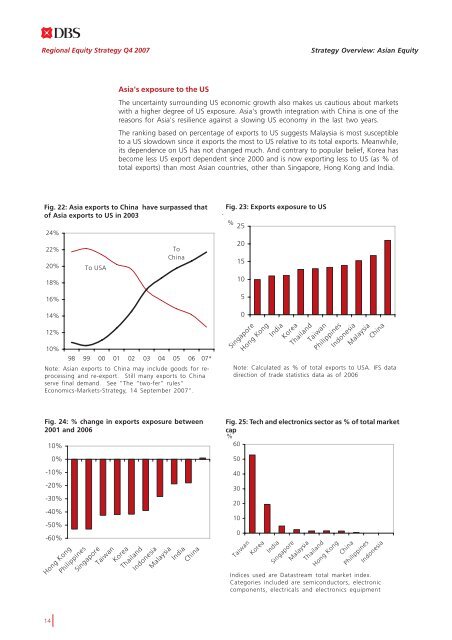
The ranking based on percentage of exports to US suggests Malaysia is most susceptible<br />
to a US slowdown since it exports <strong>the</strong> most to US relative to its total exports. Meanwhile,<br />
its dependence on US has not changed much. And contrary to popular belief, Korea has<br />
become less US export dependent since 2000 <strong>and</strong> is now exporting less to US (as % of<br />
total exports) than most Asian countries, o<strong>the</strong>r than Singapore, Hong Kong <strong>and</strong> India.<br />
Fig. 22: Asia exports to China have surpassed that<br />
of Asia exports to US in 2003<br />
24%<br />
22%<br />
20%<br />
18%<br />
16%<br />
14%<br />
12%<br />
To USA<br />
To<br />
China<br />
10%<br />
98 99 00 01 02 03 04 05 06 07*<br />
Note: Asian exports to China may include goods for reprocessing<br />
<strong>and</strong> re-export. Still many exports to China<br />
serve final dem<strong>and</strong>. See "The “two-fer” rules"<br />
Economics-Markets-<strong>Strategy</strong>, 14 September 2007".<br />
Fig. 23: Exports exposure to US<br />
%<br />
25<br />
20<br />
15<br />
10<br />
5<br />
0<br />
Singapore<br />
Hong Kong<br />
India<br />
Korea<br />
Thail<strong>and</strong><br />
Taiwan<br />
Philippines<br />
Indonesia<br />
Malaysia<br />
China<br />
Note: Calculated as % of total exports to USA. IFS data<br />
direction of trade statistics data as of 2006<br />
Fig. 24: % change in exports exposure between<br />
2001 <strong>and</strong> 2006<br />
-10%<br />
-20%<br />
-30%<br />
-40%<br />
-50%<br />
-60%<br />
14<br />
10%<br />
0%<br />
Hong Kong<br />
Philippines<br />
Singapore<br />
Taiwan<br />
Korea<br />
Thail<strong>and</strong><br />
Indonesia<br />
Malaysia<br />
India<br />
China<br />
Fig. 25: Tech <strong>and</strong> electronics sector as % of total market<br />
cap<br />
%<br />
60<br />
50<br />
40<br />
30<br />
20<br />
10<br />
0<br />
Taiwan<br />
Korea<br />
India<br />
Singapore<br />
Malaysia<br />
Thail<strong>and</strong><br />
Hong Kong<br />
China<br />
Philippines<br />
Indonesia<br />
Indices used are Datastream total market index.<br />
Categories included are semiconductors, electronic<br />
components, electricals <strong>and</strong> electronics equipment


