

Top Down Strategy and Large Cap Stock Picks - the DBS Vickers ...
Top Down Strategy and Large Cap Stock Picks - the DBS Vickers ...
Top Down Strategy and Large Cap Stock Picks - the DBS Vickers ...

You also want an ePaper? Increase the reach of your titles
YUMPU automatically turns print PDFs into web optimized ePapers that Google loves.
Regional Equity <strong>Strategy</strong> Q4 2007<br />
Country Assessment<br />
GROWTH<br />
We are upbeat on Singapore’s economic growth, as seen by <strong>the</strong> recent upgrades this year on<br />
GDP growth in 2007 by <strong>DBS</strong> Economists, up from 6.3% to 7.7% this year. We have kept our<br />
GDP growth forecast intact at 6.5% in 2008. Growth was broad-based, with all key engines –<br />
manufacturing, construction <strong>and</strong> services – recording robust growth. Growth in pharmaceutical<br />
output <strong>and</strong> value add from marine <strong>and</strong> aerospace engineering more than offset <strong>the</strong> slack in <strong>the</strong><br />
electronics sector.<br />
The macro outlook for Singapore remains bright, barring any slowdown from <strong>the</strong> U.S. which<br />
may derail growth. Growth will be broad-based. In addition to <strong>the</strong> twin engines of growth -<br />
construction <strong>and</strong> services sectors, manufacturing sector is <strong>the</strong> added pillar. The strong order<br />
book of Singapore’s shipyards will drive growth for <strong>the</strong> transport engineering sector over next<br />
few quarters <strong>and</strong> into 2008. Toge<strong>the</strong>r with output growth from <strong>the</strong> pharmaceutrical industry,<br />
<strong>the</strong>se will offset weaker exports for Electronics. The wild card lies in financial services sector<br />
which could present downside risk if fee-based <strong>and</strong> stock broking activities slacken.<br />
Net earnings in 2Q07 grew 28% yoy. Net earnings in 2Q for <strong>the</strong> basket of stocks under<br />
<strong>DBS</strong>V’s coverage grew by 28%, vs 20% in 1Q, boosted by strong growth from all major sectors<br />
including property, financial services, consumer services, property <strong>and</strong> oil <strong>and</strong> gas sectors.<br />
Growth momentum will slow in 2H, partly due to a high base in 2H06 <strong>and</strong> margin pressures<br />
kicking in.<br />
No change in earnings growth, downside pending <strong>the</strong> dust settling in <strong>the</strong> US. At this<br />
stage, o<strong>the</strong>r than potential downside to <strong>the</strong> financial sector, it is premature to determine if <strong>the</strong><br />
impact of a US slowdown could affect earnings growth in o<strong>the</strong>r sectors in Singapore. Our<br />
current estimates are for earnings growth to accelerate into FY08 at 19%. Our two-year eps<br />
cagr has been adjusted up from 17% to 18%. This is backed by strong earnings visibility from<br />
pre-booked property sales, delivery of <strong>the</strong> record order book of shipyards <strong>and</strong> growth of China<br />
consumption <strong>and</strong> infrastructure stocks covered in our universe. Even excluding growth from<br />
property <strong>and</strong> Reits, growth for Singapore equities is fairly decent at 11% in 07 rising to 13% in<br />
FY08.<br />
Potential earnings downside could come from a) Companies with exposure to <strong>the</strong> US<br />
economy, specifically <strong>the</strong> Technology <strong>and</strong> shipping sector in <strong>the</strong> event of a slowdown in <strong>the</strong> US<br />
economy b) Financial Services sector due to write-offs <strong>and</strong> provisions for its CDO exposure <strong>and</strong> a<br />
slowdown in fee-based income, from investment banking <strong>and</strong> c) margins pressure due to cost<br />
push inflation in Singapore(wages <strong>and</strong> rental) <strong>and</strong> China.<br />
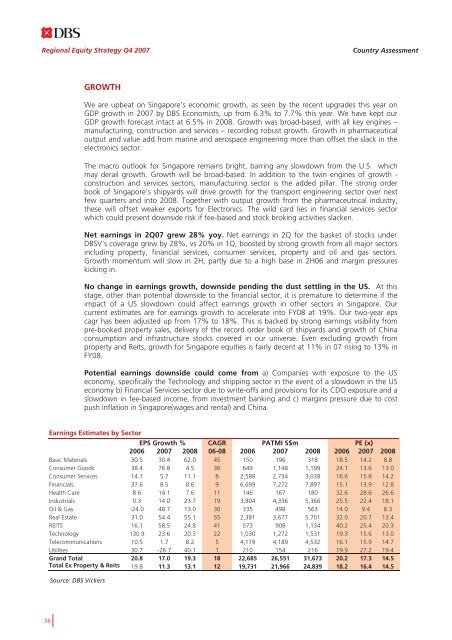
Earnings Estimates by Sector<br />
EPS Growth % CAGR PATMI S$m PE (x)<br />
2006 2007 2008 06-08 2006 2007 2008 2006 2007 2008<br />
Basic Materials 30.5 30.4 62.0 45 150 196 318 18.5 14.2 8.8<br />
Consumer Goods 38.4 76.8 4.5 36 649 1,148 1,199 24.1 13.6 13.0<br />
Consumer Services 14.1 5.7 11.1 8 2,588 2,734 3,038 16.6 15.8 14.2<br />
Financials 37.6 8.5 8.6 9 6,699 7,272 7,897 15.1 13.9 12.8<br />
Health Care 8.6 14.1 7.6 11 146 167 180 32.6 28.6 26.6<br />
Industrials 0.3 14.0 23.7 19 3,804 4,336 5,366 25.5 22.4 18.1<br />
Oil & Gas -24.0 48.7 13.0 30 335 498 563 14.0 9.4 8.3<br />
Real Estate 31.0 54.4 55.1 55 2,381 3,677 5,701 32.0 20.7 13.4<br />
REITS 16.1 58.5 24.8 41 573 908 1,134 40.2 25.4 20.3<br />
Technology 130.9 23.6 20.3 22 1,030 1,272 1,531 19.3 15.6 13.0<br />
Telecommunications 10.5 1.7 8.2 5 4,119 4,189 4,532 16.1 15.9 14.7<br />
Utilities 30.7 -26.7 40.1 1 210 154 216 19.9 27.2 19.4<br />
Gr<strong>and</strong> Total 20.8 17.0 19.3 18 22,685 26,551 31,673 20.2 17.3 14.5<br />
Total Ex Property & Reits 19.8 11.3 13.1 12 19,731 21,966 24,839 18.2 16.4 14.5<br />
Source: <strong>DBS</strong> <strong>Vickers</strong><br />
36


