

Top Down Strategy and Large Cap Stock Picks - the DBS Vickers ...
Top Down Strategy and Large Cap Stock Picks - the DBS Vickers ...
Top Down Strategy and Large Cap Stock Picks - the DBS Vickers ...

Create successful ePaper yourself
Turn your PDF publications into a flip-book with our unique Google optimized e-Paper software.
Regional Equity <strong>Strategy</strong> Q4 2007<br />
<strong>Strategy</strong> Overview: Asian Equity<br />
Fig. 2: G3 <strong>and</strong> Asia GDP Growth forecasts<br />
1Q07 (f) 2Q07 (f) 3Q07 (f) 4Q07 (f) 1Q08 (f) 2Q08 (f) 3Q08 (f) 2006 2007f 2008f<br />
US** 0.7 4.0 2.0 2.5 2.7 2.8 2.8 2.9 2.0 2.7<br />
Japan** 3.2 -1.2 3.2 1.9 1.2 3.2 2.9 2.2 2.1 2.1<br />
Eurozone** 2.4 1.4 1.6 2.9 2.3 2.3 2.2 2.9 2.5 2.3<br />
Indonesia 6.0 6.3 6.2 6.3 6.2 6.4 6.6 5.5 6.2 6.5<br />
Malaysia 5.5 5.7 6.3 6.2 5.4 5.7 5.8 5.9 5.9 5.8<br />
Philippines 6.9 7.5 6.5 6.6 6.6 6.8 6.4 5.4 6.9 6.6<br />
Singapore 6.4 8.6 8.1 7.7 6.4 6.7 6.6 7.9 7.3 6.5<br />
Thail<strong>and</strong> 4.3 4.4 4.6 4.5 4.4 5.5 6.5 5.0 4.3 5.6<br />
China 11.1 11.9 11.3 11.0 10.5 10.3 10.1 10.7 11.5 10.0<br />
Hong Kong 5.6 6.9 6.0 5.3 5.8 5.3 6.1 6.8 6.0 5.6<br />
Taiwan 4.2 5.1 4.4 4.7 4.6 4.6 4.8 4.7 4.6 4.8<br />
Korea 4.0 5.0 4.8 5.0 4.9 4.7 5.0 5.0 4.7 4.9<br />
India* 9.1 9.3 9.1 8.4 8.1 8.0 8.7 9.4 8.6 9.0<br />
Asia ex-J Average 6.3 7.1 6.7 6.6 6.3 6.4 6.7 6.6 6.6 6.5<br />
Ex-China, India 5.2 5.8 5.5 5.5 5.4 5.6 5.9 5.5 5.5 5.7<br />
* India year refers to fiscal years beginning April of calendar year. Quarterly data are<br />
annualised qtr-on-qtr % change for G3, yr-on-yr % change for Asian economies. Shaded<br />
cells indicate higher growth than previous period<br />
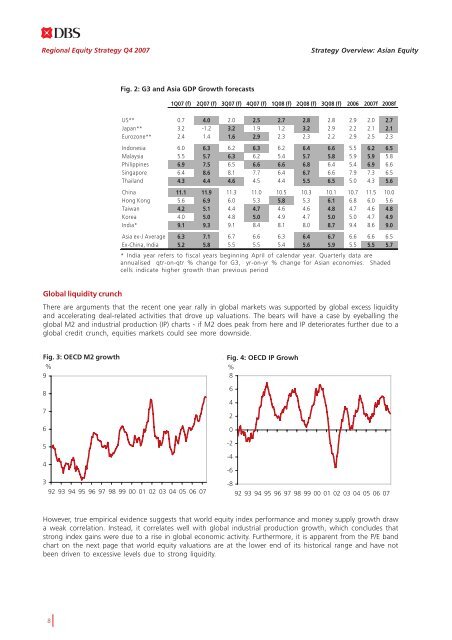
Global liquidity crunch<br />
There are arguments that <strong>the</strong> recent one year rally in global markets was supported by global excess liquidity<br />
<strong>and</strong> accelerating deal-related activities that drove up valuations. The bears will have a case by eyeballing <strong>the</strong><br />
global M2 <strong>and</strong> industrial production (IP) charts - if M2 does peak from here <strong>and</strong> IP deteriorates fur<strong>the</strong>r due to a<br />
global credit crunch, equities markets could see more downside.<br />
Fig. 3: OECD M2 growth<br />
%<br />
9<br />
8<br />
7<br />
6<br />
5<br />
4<br />
3<br />
92 93 94 95 96 97 98 99 00 01 02 03 04 05 06 07<br />
Fig. 4: OECD IP Growh<br />
%<br />
8<br />
6<br />
4<br />
2<br />
0<br />
-2<br />
-4<br />
-6<br />
-8<br />
92 93 94 95 96 97 98 99 00 01 02 03 04 05 06 07<br />
However, true empirical evidence suggests that world equity index performance <strong>and</strong> money supply growth draw<br />
a weak correlation. Instead, it correlates well with global industrial production growth, which concludes that<br />
strong index gains were due to a rise in global economic activity. Fur<strong>the</strong>rmore, it is apparent from <strong>the</strong> P/E b<strong>and</strong><br />
chart on <strong>the</strong> next page that world equity valuations are at <strong>the</strong> lower end of its historical range <strong>and</strong> have not<br />
been driven to excessive levels due to strong liquidity.<br />
8


