

Monthly Bulletin July 2009 - Banque de France
Monthly Bulletin July 2009 - Banque de France
Monthly Bulletin July 2009 - Banque de France

Create successful ePaper yourself
Turn your PDF publications into a flip-book with our unique Google optimized e-Paper software.
EURO AREA<br />
STATISTICS<br />
Money, banking<br />
and investment<br />
funds<br />
2.3 Monetary statistics 1)<br />
(EUR billions and annual growth rates; seasonally adjusted; outstanding amounts and growth rates at end of period, transactions during period)<br />
2. Components of monetary aggregates and longer-term financial liabilities<br />
Currency in Overnight Deposits Deposits Repos Money Debt Debt Deposits Deposits Capital<br />
circulation <strong>de</strong>posits with agreed re<strong>de</strong>emable market securities securities re<strong>de</strong>emable with agreed and<br />
maturity up at notice up fund up to over at notice maturity reserves<br />
to 2 years to 3 months shares/units 2 years 2 years over 3 months over 2 years<br />
1 2 3 4 5 6 7 8 9 10 11<br />
Outstanding amounts<br />
2006 578.4 3,106.7 1,404.9 1,554.1 267.1 636.5 196.0 2,385.7 102.0 1,659.9 1,280.2<br />
2007 625.6 3,212.2 1,977.3 1,541.1 307.4 686.2 314.9 2,547.4 119.3 1,814.8 1,486.6<br />
2008 Q3 662.9 3,231.4 2,453.8 1,532.2 342.5 736.5 288.2 2,616.7 114.8 1,833.3 1,558.9<br />
Q4 710.0 3,271.9 2,478.8 1,567.4 354.1 756.2 268.8 2,573.1 121.2 1,992.8 1,607.0<br />
<strong>2009</strong> Jan. 716.8 3,386.9 2,387.9 1,598.3 322.8 768.2 219.0 2,627.2 123.7 2,038.2 1,655.0<br />
Feb. 721.8 3,415.3 2,355.6 1,624.4 327.7 779.9 217.3 2,641.7 123.0 2,057.8 1,668.4<br />
Mar. 727.5 3,395.8 2,318.2 1,642.4 337.5 780.5 195.0 2,600.2 124.2 2,075.6 1,657.0<br />
Apr. 729.8 3,470.8 2,292.7 1,667.4 337.1 770.6 206.9 2,594.9 125.9 2,089.4 1,667.2<br />
May (p) 730.0 3,459.7 2,257.1 1,679.2 326.1 753.3 203.0 2,584.9 128.2 2,099.9 1,696.0<br />
Transactions<br />
2006 57.3 203.1 297.9 10.8 30.1 29.9 70.0 216.4 15.3 137.6 58.9<br />
2007 46.7 102.1 582.3 -52.5 42.2 58.7 123.4 147.5 9.7 160.4 149.5<br />
2008 83.4 42.5 467.2 19.8 48.1 33.2 -37.0 10.8 0.6 20.8 141.9<br />
2008 Q4 47.1 37.9 22.2 35.0 13.2 13.7 -17.1 -46.5 6.5 6.4 43.2<br />
<strong>2009</strong> Q1 16.1 91.4 -178.5 74.6 -16.7 25.7 -70.8 13.1 2.2 77.3 37.4<br />
<strong>2009</strong> Jan. 5.4 77.9 -115.1 30.3 -31.5 13.2 -45.4 14.2 1.7 38.8 23.9<br />
Feb. 5.1 28.4 -31.3 26.1 4.9 11.9 -1.7 12.3 -0.7 19.2 10.8<br />
Mar. 5.6 -14.9 -32.1 18.2 9.9 0.5 -23.7 -13.4 1.2 19.2 2.7<br />
Apr. 2.3 90.7 -41.8 25.6 -0.4 -8.6 11.7 -9.8 1.0 11.3 13.4<br />
May (p) 0.2 -7.5 -30.5 11.9 -10.9 -6.8 -5.6 15.9 2.2 12.3 31.1<br />
Growth rates<br />
2006 Dec. 11.0 7.0 26.8 0.7 12.8 4.8 55.2 9.9 17.7 9.0 4.8<br />
2007 Dec. 8.1 3.3 41.3 -3.4 15.8 9.2 63.6 6.2 9.5 9.7 11.4<br />
2008 Sep. 8.2 -0.1 34.4 -1.7 16.5 4.1 5.4 2.3 -5.6 3.8 12.2<br />
Dec. 13.3 1.3 23.4 1.3 15.6 4.8 -12.2 0.4 0.5 1.1 9.7<br />
<strong>2009</strong> Jan. 13.7 3.4 14.6 3.9 5.9 2.8 -25.3 0.2 0.6 2.9 10.4<br />
Feb. 13.6 4.8 9.4 5.6 5.4 3.8 -20.1 1.3 1.3 4.1 10.8<br />
Mar. 13.8 4.4 6.2 6.6 8.5 4.2 -27.1 0.6 3.7 5.0 10.4<br />
Apr. 13.2 7.4 0.3 8.0 3.6 3.2 -20.2 -0.2 5.1 5.4 10.4<br />
May (p) 13.1 6.9 -2.8 9.3 1.9 2.7 -26.5 0.0 7.7 5.6 12.3<br />
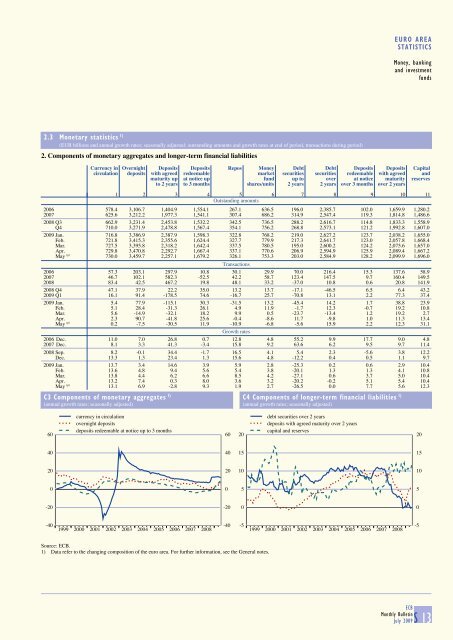
C3 Components of monetary aggregates 1)<br />
(annual growth rates; seasonally adjusted)<br />
C4 Components of longer-term financial liabilities 1)<br />
(annual growth rates; seasonally adjusted)<br />
60<br />
currency in circulation<br />
overnight <strong>de</strong>posits<br />
<strong>de</strong>posits re<strong>de</strong>emable at notice up to 3 months<br />
60<br />
20<br />
<strong>de</strong>bt securities over 2 years<br />
<strong>de</strong>posits with agreed maturity over 2 years<br />
capital and reserves<br />
20<br />
40<br />
40<br />
15<br />
15<br />
20<br />
20<br />
10<br />
10<br />
0<br />
0<br />
5<br />
5<br />
-20<br />
-20<br />
0<br />
0<br />
-40<br />
1999 2000 2001 2002 2003 2004 2005 2006 2007 2008<br />
-40<br />
-5<br />
1999 2000 2001 2002 2003 2004 2005 2006 2007 2008<br />
-5<br />
Source: ECB.<br />
1) Data refer to the changing composition of the euro area. For further information, see the General notes.<br />
ECB<br />
<strong>Monthly</strong> <strong>Bulletin</strong><br />
<strong>July</strong> <strong>2009</strong>S 13


