

Monthly Bulletin July 2009 - Banque de France
Monthly Bulletin July 2009 - Banque de France
Monthly Bulletin July 2009 - Banque de France

You also want an ePaper? Increase the reach of your titles
YUMPU automatically turns print PDFs into web optimized ePapers that Google loves.
others also take into account the revenue si<strong>de</strong> of<br />
government finances. The literature i<strong>de</strong>ntifies<br />
three main channels through which to assess the<br />
fiscal costs of financial instability, 6 namely:<br />
(i) direct bailout costs (either excluding or<br />
including the future sale of financial sector assets<br />
acquired by the government); (ii) a loss of tax<br />
revenues from lower capital gains, asset turnover<br />
and consumption; and (iii) second-round effects<br />
from asset price changes on the real economy<br />
and the cyclical component of the budget balance<br />
and via government <strong>de</strong>bt service costs. These<br />
fiscal costs have to be weighed against the<br />
economic and social benefits of stabilising the<br />
financial sector.<br />
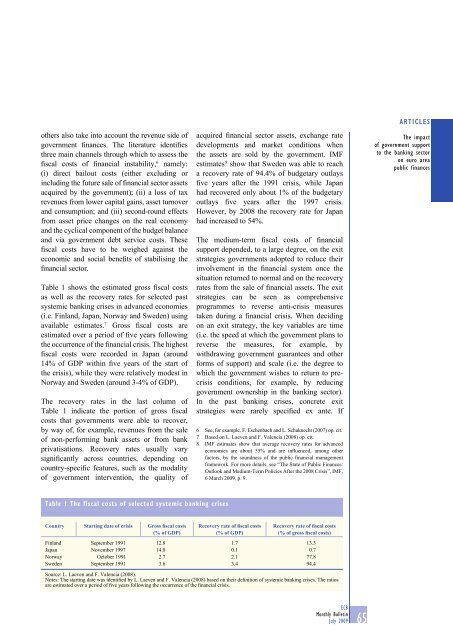
Table 1 shows the estimated gross fiscal costs<br />
as well as the recovery rates for selected past<br />
systemic banking crises in advanced economies<br />
(i.e. Finland, Japan, Norway and Swe<strong>de</strong>n) using<br />
available estimates. 7 Gross fiscal costs are<br />
estimated over a period of five years following<br />
the occurrence of the financial crisis. The highest<br />
fiscal costs were recor<strong>de</strong>d in Japan (around<br />
14% of GDP within five years of the start of<br />
the crisis), while they were relatively mo<strong>de</strong>st in<br />
Norway and Swe<strong>de</strong>n (around 3-4% of GDP).<br />
The recovery rates in the last column of<br />
Table 1 indicate the portion of gross fiscal<br />
costs that governments were able to recover,<br />
by way of, for example, revenues from the sale<br />
of non-performing bank assets or from bank<br />
privatisations. Recovery rates usually vary<br />
significantly across countries, <strong>de</strong>pending on<br />
country-specific features, such as the modality<br />
of government intervention, the quality of<br />
acquired financial sector assets, exchange rate<br />
<strong>de</strong>velopments and market conditions when<br />
the assets are sold by the government. IMF<br />
estimates 8 show that Swe<strong>de</strong>n was able to reach<br />
a recovery rate of 94.4% of budgetary outlays<br />
five years after the 1991 crisis, while Japan<br />
had recovered only about 1% of the budgetary<br />
outlays five years after the 1997 crisis.<br />
However, by 2008 the recovery rate for Japan<br />
had increased to 54%.<br />
The medium-term fiscal costs of financial<br />
support <strong>de</strong>pen<strong>de</strong>d, to a large <strong>de</strong>gree, on the exit<br />
strategies governments adopted to reduce their<br />
involvement in the financial system once the<br />
situation returned to normal and on the recovery<br />
rates from the sale of financial assets. The exit<br />
strategies can be seen as comprehensive<br />
programmes to reverse anti-crisis measures<br />
taken during a financial crisis. When <strong>de</strong>ciding<br />
on an exit strategy, the key variables are time<br />
(i.e. the speed at which the government plans to<br />
reverse the measures, for example, by<br />
withdrawing government guarantees and other<br />
forms of support) and scale (i.e. the <strong>de</strong>gree to<br />
which the government wishes to return to precrisis<br />
conditions, for example, by reducing<br />
government ownership in the banking sector).<br />
In the past banking crises, concrete exit<br />
strategies were rarely specified ex ante. If<br />
6 See, for example, F. Eschenbach and L. Schuknecht (2007) op. cit.<br />
7 Based on L. Laeven and F. Valencia (2008) op. cit.<br />
8 IMF estimates show that average recovery rates for advanced<br />
economies are about 55% and are influenced, among other<br />
factors, by the soundness of the public financial management<br />
framework. For more <strong>de</strong>tails, see “The State of Public Finances:<br />
Outlook and Medium-Term Policies After the 2008 Crisis”, IMF,<br />
6 March <strong>2009</strong>, p. 9.<br />
ARTICLES<br />
The impact<br />
of government support<br />
to the banking sector<br />
on euro area<br />
public finances<br />
Table 1 The fiscal costs of selected systemic banking crises<br />
Country Starting date of crisis Gross fiscal costs<br />
(% of GDP)<br />
Recovery rate of fiscal costs<br />
(% of GDP)<br />
Recovery rate of fiscal costs<br />
(% of gross fiscal costs)<br />
Finland September 1991 12.8 1.7 13.3<br />
Japan November 1997 14.0 0.1 0.7<br />
Norway October 1991 2.7 2.1 77.8<br />
Swe<strong>de</strong>n September 1991 3.6 3.4 94.4<br />
Source: L. Laeven and F. Valencia (2008).<br />
Notes: The starting date was i<strong>de</strong>ntified by L. Laeven and F. Valencia (2008) based on their <strong>de</strong>finition of systemic banking crises. The ratios<br />
are estimated over a period of five years following the occurrence of the financial crisis.<br />
ECB<br />
<strong>Monthly</strong> <strong>Bulletin</strong><br />
<strong>July</strong> <strong>2009</strong><br />
65


