

Monthly Bulletin July 2009 - Banque de France
Monthly Bulletin July 2009 - Banque de France
Monthly Bulletin July 2009 - Banque de France

Create successful ePaper yourself
Turn your PDF publications into a flip-book with our unique Google optimized e-Paper software.
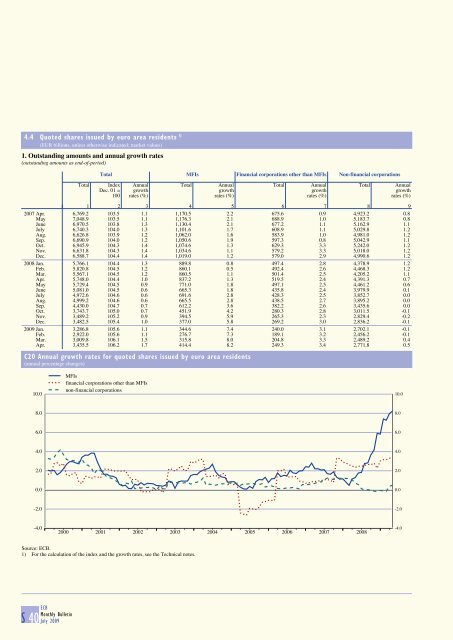
4.4 Quoted shares issued by euro area resi<strong>de</strong>nts 1)<br />
(EUR billions, unless otherwise indicated; market values)<br />
1. Outstanding amounts and annual growth rates<br />
(outstanding amounts as end-of-period)<br />
Total MFIs Financial corporations other than MFIs Non-financial corporations<br />
Total In<strong>de</strong>x Annual Total Annual Total Annual Total Annual<br />
Dec. 01 = growth growth growth growth<br />
100 rates (%) rates (%) rates (%) rates (%)<br />
1 2 3 4 5 6 7 8 9<br />
2007 Apr. 6,769.2 103.5 1.1 1,170.5 2.2 675.6 0.9 4,923.2 0.8<br />
May 7,048.9 103.5 1.1 1,176.3 2.1 688.9 1.0 5,183.7 0.8<br />
June 6,970.5 103.8 1.3 1,130.4 2.1 677.2 1.1 5,162.9 1.1<br />
<strong>July</strong> 6,740.3 104.0 1.3 1,101.6 1.7 608.9 1.1 5,029.8 1.2<br />
Aug. 6,626.8 103.9 1.2 1,062.0 1.6 583.9 1.0 4,981.0 1.2<br />
Sep. 6,690.9 104.0 1.2 1,050.6 1.9 597.3 0.8 5,042.9 1.1<br />
Oct. 6,945.9 104.3 1.4 1,074.6 1.3 629.3 3.3 5,242.0 1.2<br />
Nov. 6,631.8 104.3 1.4 1,034.6 1.1 579.2 3.3 5,018.0 1.2<br />
Dec. 6,588.7 104.4 1.4 1,019.0 1.2 579.0 2.9 4,990.6 1.2<br />
2008 Jan. 5,766.1 104.4 1.3 889.8 0.8 497.4 2.8 4,378.9 1.2<br />
Feb. 5,820.8 104.5 1.2 860.1 0.5 492.4 2.6 4,468.3 1.2<br />
Mar. 5,567.1 104.5 1.2 860.5 1.1 501.4 2.5 4,205.2 1.1<br />
Apr. 5,748.0 104.4 1.0 837.2 1.3 519.5 2.4 4,391.3 0.7<br />
May 5,729.4 104.5 0.9 771.0 1.8 497.1 2.5 4,461.2 0.6<br />
June 5,081.0 104.5 0.6 665.3 1.8 435.8 2.4 3,979.9 0.1<br />
<strong>July</strong> 4,972.6 104.6 0.6 691.6 2.8 428.3 2.5 3,852.7 0.0<br />
Aug. 4,999.2 104.6 0.6 665.5 2.8 438.5 2.7 3,895.2 0.0<br />
Sep. 4,430.0 104.7 0.7 612.2 3.6 382.2 2.6 3,435.6 0.0<br />
Oct. 3,743.7 105.0 0.7 451.9 4.2 280.3 2.8 3,011.5 -0.1<br />
Nov. 3,489.2 105.2 0.9 394.5 5.9 265.3 2.3 2,829.4 -0.2<br />
Dec. 3,482.5 105.4 1.0 377.0 5.8 269.2 3.0 2,836.2 -0.1<br />
<strong>2009</strong> Jan. 3,286.8 105.6 1.1 344.6 7.4 240.0 3.1 2,702.1 -0.1<br />
Feb. 2,922.0 105.6 1.1 276.7 7.3 189.1 3.2 2,456.2 -0.1<br />
Mar. 3,009.8 106.1 1.5 315.8 8.0 204.8 3.3 2,489.2 0.4<br />
Apr. 3,435.5 106.2 1.7 414.4 8.2 249.3 3.4 2,771.8 0.5<br />
C20 Annual growth rates for quoted shares issued by euro area resi<strong>de</strong>nts<br />
(annual percentage changes)<br />
10.0<br />
MFIs<br />
financial corporations other than MFIs<br />
non-financial corporations<br />
10.0<br />
8.0<br />
8.0<br />
6.0<br />
6.0<br />
4.0<br />
4.0<br />
2.0<br />
2.0<br />
0.0<br />
0.0<br />
-2.0<br />
-2.0<br />
-4.0<br />
2000 2001 2002 2003 2004 2005 2006 2007 2008<br />
-4.0<br />
Source: ECB.<br />
1) For the calculation of the in<strong>de</strong>x and the growth rates, see the Technical notes.<br />
S 40 ECB<br />
<strong>Monthly</strong> <strong>Bulletin</strong><br />
<strong>July</strong> <strong>2009</strong>


