

Monthly Bulletin July 2009 - Banque de France
Monthly Bulletin July 2009 - Banque de France
Monthly Bulletin July 2009 - Banque de France

You also want an ePaper? Increase the reach of your titles
YUMPU automatically turns print PDFs into web optimized ePapers that Google loves.
EURO AREA<br />
STATISTICS<br />
External<br />
transactions<br />
and<br />
positions<br />
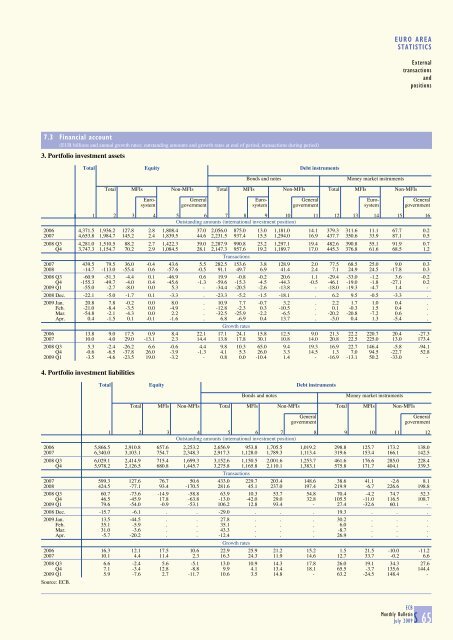
7.3 Financial account<br />
(EUR billions and annual growth rates; outstanding amounts and growth rates at end of period, transactions during period)<br />
3. Portfolio investment assets<br />
Total Equity Debt instruments<br />
Bonds and notes Money market instruments<br />
Total MFIs Non-MFIs Total MFIs Non-MFIs Total MFIs Non-MFIs<br />
Euro- General Euro- General Euro- General<br />
system government system government system government<br />
1 2 3 4 5 6 7 8 9 10 11 12 13 14 15 16<br />
Outstanding amounts (international investment position)<br />
2006 4,371.5 1,936.2 127.8 2.8 1,808.4 37.0 2,056.0 875.0 13.0 1,181.0 14.1 379.3 311.6 11.1 67.7 0.2<br />
2007 4,653.8 1,984.7 145.2 2.4 1,839.5 44.6 2,231.5 937.4 15.5 1,294.0 16.9 437.7 350.6 33.9 87.1 0.5<br />
2008 Q3 4,281.0 1,510.5 88.2 2.7 1,422.3 39.0 2,287.9 990.8 23.2 1,297.1 19.4 482.6 390.8 55.1 91.9 0.7<br />
Q4 3,747.3 1,154.7 70.2 2.9 1,084.5 28.1 2,147.3 957.6 19.2 1,189.7 17.0 445.3 376.8 61.6 68.5 1.2<br />
Transactions<br />
2007 439.5 79.5 36.0 -0.4 43.6 5.5 282.5 153.6 3.8 128.9 2.0 77.5 68.5 25.0 9.0 0.3<br />
2008 -14.7 -113.0 -55.4 0.6 -57.6 -0.5 91.1 49.7 6.9 41.4 2.4 7.1 24.9 24.5 -17.8 0.3<br />
2008 Q3 -60.9 -51.3 -4.4 0.1 -46.9 0.6 19.9 -0.8 -0.2 20.6 1.1 -29.4 -33.0 -1.2 3.6 -0.2<br />
Q4 -155.3 -49.7 -4.0 0.4 -45.6 -1.3 -59.6 -15.3 -4.5 -44.3 -0.5 -46.1 -19.0 -1.8 -27.1 0.2<br />
<strong>2009</strong> Q1 -55.0 -2.7 -8.0 0.0 5.3 - -34.4 -20.5 -2.6 -13.8 - -18.0 -19.3 -4.7 1.4 -<br />
2008 Dec. -22.1 -5.0 -1.7 0.1 -3.3 . -23.3 -5.2 -1.5 -18.1 . 6.2 9.5 -0.5 -3.3 .<br />
<strong>2009</strong> Jan. 20.8 7.8 -0.2 0.0 8.0 . 10.9 7.7 -0.7 3.2 . 2.2 1.7 1.0 0.4 .<br />
Feb. -21.0 -8.4 -3.5 0.0 -4.9 . -12.8 -2.3 0.3 -10.5 . 0.1 -0.3 1.5 0.4 .<br />
Mar. -54.8 -2.1 -4.3 0.0 2.2 . -32.5 -25.9 -2.2 -6.5 . -20.2 -20.8 -7.2 0.6 .<br />
Apr. 0.4 -1.5 0.1 -0.1 -1.6 . 6.8 -6.9 0.4 13.7 . -5.0 0.4 1.3 -5.4 .<br />
Growth rates<br />
2006 13.8 9.0 17.5 0.9 8.4 22.1 17.1 24.1 15.8 12.5 9.0 21.3 22.2 220.7 20.4 -27.3<br />
2007 10.0 4.0 29.0 -13.1 2.3 14.4 13.8 17.8 30.1 10.8 14.0 20.8 22.5 225.0 13.0 173.4<br />
2008 Q3 5.3 -2.4 -26.2 6.6 -0.6 4.4 9.8 10.3 65.0 9.4 19.3 16.9 22.7 146.4 -5.8 -94.1<br />
Q4 -0.6 -6.5 -37.8 26.0 -3.9 -1.3 4.1 5.3 26.0 3.3 14.5 1.3 7.0 94.5 -22.7 52.8<br />
<strong>2009</strong> Q1 -3.5 -4.6 -23.5 19.0 -3.2 - 0.8 0.0 -10.4 1.4 - -16.9 -13.1 50.2 -33.0 -<br />
4. Portfolio investment liabilities<br />
Total Equity Debt instruments<br />
Bonds and notes Money market instruments<br />
Total MFIs Non-MFIs Total MFIs Non-MFIs Total MFIs Non-MFIs<br />
General<br />
government<br />
General<br />
government<br />
1 2 3 4 5 6 7 8 9 10 11 12<br />
Outstanding amounts (international investment position)<br />
2006 5,866.5 2,910.8 657.6 2,253.2 2,656.9 953.8 1,705.5 1,019.2 298.8 125.7 173.2 138.0<br />
2007 6,340.0 3,103.1 754.7 2,348.3 2,917.3 1,128.0 1,789.3 1,113.4 319.6 153.4 166.1 142.5<br />
2008 Q3 6,029.1 2,414.9 715.4 1,699.3 3,152.6 1,150.5 2,001.6 1,253.7 461.6 176.6 285.0 228.4<br />
Q4 5,978.2 2,126.5 680.8 1,445.7 3,275.8 1,165.8 2,110.1 1,383.1 575.8 171.7 404.1 339.3<br />
Transactions<br />
2007 599.3 127.6 76.7 50.6 433.0 229.7 203.4 148.6 38.6 41.1 -2.6 8.1<br />
2008 424.5 -77.1 93.4 -170.5 281.6 45.1 237.0 197.4 219.9 -6.7 226.6 198.8<br />
2008 Q3 60.7 -73.6 -14.9 -58.8 63.9 10.3 53.7 54.8 70.4 -4.2 74.7 52.3<br />
Q4 46.5 -45.9 17.8 -63.8 -13.0 -42.0 29.0 32.8 105.5 -11.0 116.5 108.7<br />
<strong>2009</strong> Q1 79.6 -54.0 -0.9 -53.1 106.2 12.8 93.4 - 27.4 -32.6 60.1 -<br />
2008 Dec. -15.7 -6.1 . . -29.0 . . . 19.3 . . .<br />
<strong>2009</strong> Jan. 13.5 -44.5 . . 27.8 . . . 30.2 . . .<br />
Feb. 35.1 -5.9 . . 35.1 . . . 6.0 . . .<br />
Mar. 31.0 -3.6 . . 43.3 . . . -8.7 . . .<br />
Apr. -5.7 -20.2 . . -12.4 . . . 26.9 . . .<br />
Growth rates<br />
2006 16.3 12.1 17.5 10.6 22.9 25.9 21.2 15.2 1.5 21.5 -10.0 -11.2<br />
2007 10.1 4.4 11.4 2.3 16.3 24.3 11.9 14.6 12.7 33.7 -0.2 6.6<br />
2008 Q3 6.6 -2.4 5.6 -5.1 13.0 10.9 14.3 17.8 26.0 19.1 34.3 27.6<br />
Q4 7.1 -3.4 12.8 -8.8 9.9 4.1 13.4 18.1 65.5 -3.7 135.6 144.4<br />
<strong>2009</strong> Q1 5.9 -7.6 2.7 -11.7 10.6 3.5 14.8 - 63.2 -24.5 148.4 -<br />
Source: ECB.<br />
ECB<br />
<strong>Monthly</strong> <strong>Bulletin</strong><br />
<strong>July</strong> <strong>2009</strong>S 65


