

Monthly Bulletin July 2009 - Banque de France
Monthly Bulletin July 2009 - Banque de France
Monthly Bulletin July 2009 - Banque de France

Create successful ePaper yourself
Turn your PDF publications into a flip-book with our unique Google optimized e-Paper software.
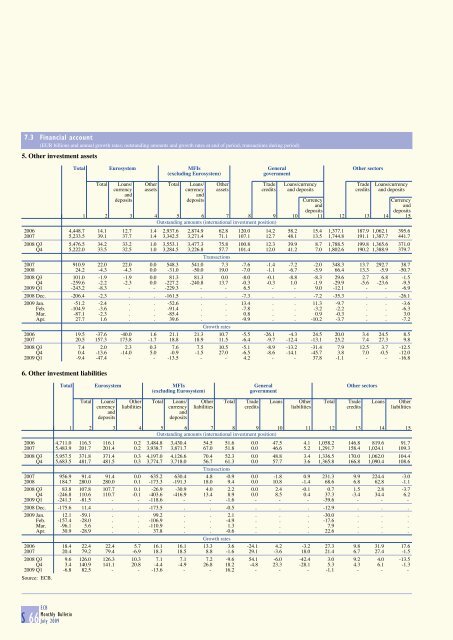
7.3 Financial account<br />
(EUR billions and annual growth rates; outstanding amounts and growth rates at end of period, transactions during period)<br />
5. Other investment assets<br />
Total Eurosystem MFIs General Other sectors<br />
(excluding Eurosystem) government<br />
Total Loans/ Other Total Loans/ Other Tra<strong>de</strong> Loans/currency Tra<strong>de</strong> Loans/currency<br />
currency assets currency assets credits and <strong>de</strong>posits credits and <strong>de</strong>posits<br />
and<br />
and<br />
<strong>de</strong>posits <strong>de</strong>posits Currency Currency<br />
and<br />
and<br />
<strong>de</strong>posits<br />
<strong>de</strong>posits<br />
1 2 3 4 5 6 7 8 9 10 11 12 13 14 15<br />
Outstanding amounts (international investment position)<br />
2006 4,448.7 14.1 12.7 1.4 2,937.6 2,874.9 62.8 120.0 14.2 58.2 15.4 1,377.1 187.9 1,062.1 395.6<br />
2007 5,233.5 39.1 37.7 1.4 3,342.5 3,271.4 71.1 107.1 12.7 48.1 13.5 1,744.8 191.1 1,387.7 441.7<br />
2008 Q3 5,476.5 34.2 33.2 1.0 3,553.1 3,477.3 75.8 100.8 12.3 39.9 8.7 1,788.5 199.8 1,365.6 371.0<br />
Q4 5,222.0 33.5 32.5 1.0 3,284.5 3,226.8 57.7 101.4 12.0 41.2 7.0 1,802.6 190.2 1,388.9 379.7<br />
Transactions<br />
2007 910.9 22.0 22.0 0.0 548.3 541.0 7.3 -7.6 -1.4 -7.2 -2.0 348.3 13.7 292.7 38.7<br />
2008 24.2 -4.3 -4.3 0.0 -31.0 -50.0 19.0 -7.0 -1.1 -6.7 -5.9 66.4 13.3 -5.9 -50.7<br />
2008 Q3 101.0 -1.9 -1.9 0.0 81.3 81.3 0.0 -8.0 -0.1 -8.8 -8.3 29.6 2.7 6.8 -1.5<br />
Q4 -259.6 -2.2 -2.3 0.0 -227.2 -240.8 13.7 -0.3 -0.3 1.0 -1.9 -29.9 -5.6 -23.6 -9.5<br />
<strong>2009</strong> Q1 -243.2 -8.3 - - -229.3 - - 6.5 - - 9.0 -12.1 - - -6.9<br />
2008 Dec. -206.4 -2.3 . . -161.5 . . -7.3 . . -7.2 -35.3 . . -26.1<br />
<strong>2009</strong> Jan. -51.2 -2.4 . . -52.6 . . 13.4 . . 11.3 -9.7 . . -3.6<br />
Feb. -104.9 -3.6 . . -91.4 . . -7.8 . . -3.2 -2.2 . . -6.3<br />
Mar. -87.1 -2.3 . . -85.4 . . 0.8 . . 0.9 -0.3 . . 3.0<br />
Apr. 27.7 1.6 . . 39.6 . . -9.9 . . -10.2 -3.7 . . -7.2<br />
Growth rates<br />
2006 19.5 -37.6 -40.0 1.6 21.1 21.3 10.7 -5.5 -26.1 -4.3 24.5 20.0 3.4 24.5 8.5<br />
2007 20.5 157.3 173.8 -1.7 18.8 18.9 11.5 -6.4 -9.7 -12.4 -13.1 25.2 7.4 27.3 9.8<br />
2008 Q3 7.4 2.0 2.3 0.3 7.6 7.5 10.5 -5.1 -8.9 -13.2 -31.4 7.9 12.5 3.7 -12.5<br />
Q4 0.4 -13.6 -14.0 5.0 -0.9 -1.5 27.0 -6.5 -8.6 -14.1 -45.7 3.8 7.0 -0.5 -12.0<br />
<strong>2009</strong> Q1 -9.4 -47.4 - - -13.5 - - 4.2 - - 37.8 -1.1 - - -16.8<br />
6. Other investment liabilities<br />
Total Eurosystem MFIs General Other sectors<br />
(excluding Eurosystem) government<br />
Total Loans/ Other Total Loans/ Other Total Tra<strong>de</strong> Loans Other Total Tra<strong>de</strong> Loans Other<br />
currency liabilities currency liabilities credits liabilities credits liabilities<br />
and<br />
and<br />
<strong>de</strong>posits<br />
<strong>de</strong>posits<br />
1 2 3 4 5 6 7 8 9 10 11 12 13 14 15<br />
Outstanding amounts (international investment position)<br />
2006 4,711.0 116.3 116.1 0.2 3,484.8 3,430.4 54.5 51.6 0.0 47.5 4.1 1,058.2 146.8 819.6 91.7<br />
2007 5,483.9 201.7 201.4 0.2 3,938.7 3,871.7 67.0 51.8 0.0 46.6 5.2 1,291.7 158.4 1,024.1 109.3<br />
2008 Q3 5,957.5 371.8 371.4 0.3 4,197.0 4,126.6 70.4 52.3 0.0 48.8 3.4 1,336.5 170.0 1,062.0 104.4<br />
Q4 5,683.5 481.7 481.5 0.3 3,774.7 3,718.0 56.7 61.3 0.0 57.7 3.6 1,365.8 166.8 1,090.4 108.6<br />
Transactions<br />
2007 956.9 91.4 91.4 0.0 635.2 630.4 4.8 -0.9 0.0 -1.8 0.9 231.3 9.9 224.4 -3.0<br />
2008 184.7 280.0 280.0 0.1 -173.3 -191.3 18.0 9.4 0.0 10.8 -1.4 68.6 6.8 62.8 -1.1<br />
2008 Q3 83.8 107.8 107.7 0.1 -26.9 -30.9 4.0 2.2 0.0 2.4 -0.1 0.7 1.5 2.8 -3.7<br />
Q4 -246.8 110.6 110.7 -0.1 -403.6 -416.9 13.4 8.9 0.0 8.5 0.4 37.3 -3.4 34.4 6.2<br />
<strong>2009</strong> Q1 -241.3 -81.5 - - -118.6 - - -1.6 - - - -39.6 - - -<br />
2008 Dec. -175.6 11.4 . . -173.5 . . -0.5 . . . -12.9 . . .<br />
<strong>2009</strong> Jan. 12.1 -59.1 . . 99.2 . . 2.1 . . . -30.0 . . .<br />
Feb. -157.4 -28.0 . . -106.9 . . -4.9 . . . -17.6 . . .<br />
Mar. -96.1 5.6 . . -110.9 . . 1.3 . . . 7.9 . . .<br />
Apr. 30.9 -28.9 . . 37.8 . . -0.6 . . . 22.6 . . .<br />
Growth rates<br />
2006 18.4 22.4 22.4 5.7 16.1 16.1 13.3 3.6 -24.1 4.2 -3.2 27.3 9.8 31.9 17.6<br />
2007 20.4 79.2 79.4 -6.9 18.3 18.5 8.8 -1.6 29.1 -3.6 18.0 21.4 6.7 27.4 -1.5<br />
2008 Q3 9.6 126.0 126.3 10.3 7.1 7.1 7.2 -9.6 54.1 -6.0 -42.4 3.0 9.2 4.0 -13.5<br />
Q4 3.4 140.9 141.1 20.8 -4.4 -4.9 26.8 18.2 -4.8 23.3 -28.1 5.3 4.3 6.1 -1.3<br />
<strong>2009</strong> Q1 -6.8 82.5 - - -13.6 - - 16.2 - - - -1.1 - - -<br />
Source: ECB.<br />
S 66 ECB<br />
<strong>Monthly</strong> <strong>Bulletin</strong><br />
<strong>July</strong> <strong>2009</strong>


