

Monthly Bulletin July 2009 - Banque de France
Monthly Bulletin July 2009 - Banque de France
Monthly Bulletin July 2009 - Banque de France

Create successful ePaper yourself
Turn your PDF publications into a flip-book with our unique Google optimized e-Paper software.
EURO AREA<br />
STATISTICS<br />
Prices, output,<br />
<strong>de</strong>mand and<br />
labour markets<br />
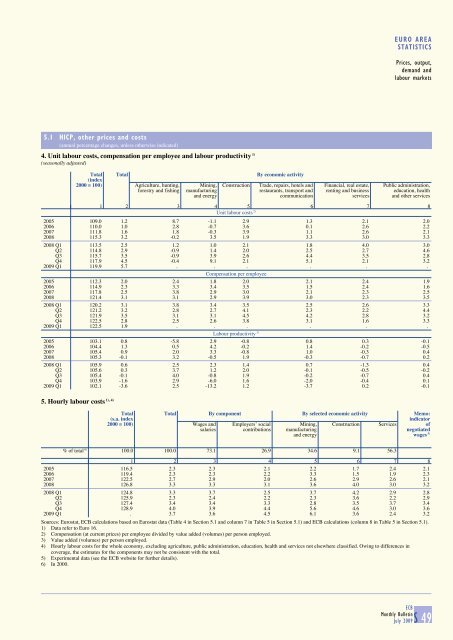
5.1 HICP, other prices and costs<br />
(annual percentage changes, unless otherwise indicated)<br />
4. Unit labour costs, compensation per employee and labour productivity 1)<br />
(seasonally adjusted)<br />
Total Total By economic activity<br />
(in<strong>de</strong>x<br />
2000 = 100) Agriculture, hunting, Mining, Construction Tra<strong>de</strong>, repairs, hotels and Financial, real estate, Public administration,<br />
forestry and fishing manufacturing restaurants, transport and renting and business education, health<br />
and energy communication services and other services<br />
1 2 3 4 5 6 7 8<br />
Unit labour costs 2)<br />
2005 109.0 1.2 8.7 -1.1 2.9 1.3 2.1 2.0<br />
2006 110.0 1.0 2.8 -0.7 3.6 0.1 2.6 2.2<br />
2007 111.8 1.6 1.8 -0.3 3.9 1.1 2.6 2.1<br />
2008 115.3 3.2 -0.2 3.5 1.9 3.3 3.0 3.3<br />
2008 Q1 113.5 2.5 1.2 1.0 2.1 1.8 4.0 3.0<br />
Q2 114.8 2.9 -0.9 1.4 2.0 2.5 2.7 4.6<br />
Q3 115.7 3.5 -0.9 3.9 2.6 4.4 3.5 2.8<br />
Q4 117.9 4.5 -0.4 9.1 2.1 5.1 2.1 3.2<br />
<strong>2009</strong> Q1 119.9 5.7 . . . . . .<br />
Compensation per employee<br />
2005 112.3 2.0 2.4 1.8 2.0 2.1 2.4 1.9<br />
2006 114.9 2.3 3.3 3.4 3.5 1.5 2.4 1.6<br />
2007 117.8 2.5 3.8 2.9 3.0 2.1 2.3 2.5<br />
2008 121.4 3.1 3.1 2.9 3.9 3.0 2.3 3.5<br />
2008 Q1 120.2 3.1 3.8 3.4 3.5 2.5 2.6 3.3<br />
Q2 121.2 3.2 2.8 2.7 4.1 2.3 2.2 4.4<br />
Q3 121.9 3.5 3.1 3.1 4.5 4.2 2.8 3.2<br />
Q4 122.5 2.8 2.5 2.6 3.8 3.1 1.6 3.3<br />
<strong>2009</strong> Q1 122.5 1.9 . . . . . .<br />
Labour productivity 3)<br />
2005 103.1 0.8 -5.8 2.9 -0.8 0.8 0.3 -0.1<br />
2006 104.4 1.3 0.5 4.2 -0.2 1.4 -0.2 -0.5<br />
2007 105.4 0.9 2.0 3.3 -0.8 1.0 -0.3 0.4<br />
2008 105.3 -0.1 3.2 -0.5 1.9 -0.3 -0.7 0.2<br />
2008 Q1 105.9 0.6 2.5 2.3 1.4 0.7 -1.3 0.4<br />
Q2 105.6 0.3 3.7 1.2 2.0 -0.1 -0.5 -0.2<br />
Q3 105.4 -0.1 4.0 -0.8 1.9 -0.2 -0.7 0.4<br />
Q4 103.9 -1.6 2.9 -6.0 1.6 -2.0 -0.4 0.1<br />
<strong>2009</strong> Q1 102.1 -3.6 2.5 -13.2 1.2 -3.7 0.2 -0.1<br />
1), 4)<br />
5. Hourly labour costs<br />
Total Total By component By selected economic activity Memo:<br />
(s.a. in<strong>de</strong>x<br />
indicator<br />
2000 = 100) Wages and Employers’ social Mining, Construction Services of<br />
salaries contributions manufacturing negotiated<br />
and energy wages 5)<br />
% of total 6) 100.0 100.0 73.1 26.9 34.6 9.1 56.3<br />
1 2 3 4 5 6 7 8<br />
2005 116.5 2.3 2.3 2.1 2.2 1.7 2.4 2.1<br />
2006 119.4 2.3 2.3 2.2 3.3 1.5 1.9 2.3<br />
2007 122.5 2.7 2.9 2.0 2.6 2.9 2.6 2.1<br />
2008 126.8 3.3 3.3 3.1 3.6 4.0 3.0 3.2<br />
2008 Q1 124.8 3.3 3.7 2.5 3.7 4.2 2.9 2.8<br />
Q2 125.9 2.3 2.4 2.2 2.3 3.6 2.2 2.9<br />
Q3 127.4 3.4 3.4 3.3 2.8 3.5 3.7 3.4<br />
Q4 128.9 4.0 3.9 4.4 5.6 4.6 3.0 3.6<br />
<strong>2009</strong> Q1 . 3.7 3.6 4.5 6.1 3.6 2.4 3.2<br />
Sources: Eurostat, ECB calculations based on Eurostat data (Table 4 in Section 5.1 and column 7 in Table 5 in Section 5.1) and ECB calculations (column 8 in Table 5 in Section 5.1).<br />
1) Data refer to Euro 16.<br />
2) Compensation (at current prices) per employee divi<strong>de</strong>d by value ad<strong>de</strong>d (volumes) per person employed.<br />
3) Value ad<strong>de</strong>d (volumes) per person employed.<br />
4) Hourly labour costs for the whole economy, excluding agriculture, public administration, education, health and services not elsewhere classified. Owing to differences in<br />
coverage, the estimates for the components may not be consistent with the total.<br />
5) Experimental data (see the ECB website for further <strong>de</strong>tails).<br />
6) In 2000.<br />
ECB<br />
<strong>Monthly</strong> <strong>Bulletin</strong><br />
<strong>July</strong> <strong>2009</strong>S 49


