

Monthly Bulletin July 2009 - Banque de France
Monthly Bulletin July 2009 - Banque de France
Monthly Bulletin July 2009 - Banque de France

Create successful ePaper yourself
Turn your PDF publications into a flip-book with our unique Google optimized e-Paper software.
EURO AREA<br />
STATISTICS<br />
Prices, output,<br />
<strong>de</strong>mand and<br />
labour markets<br />
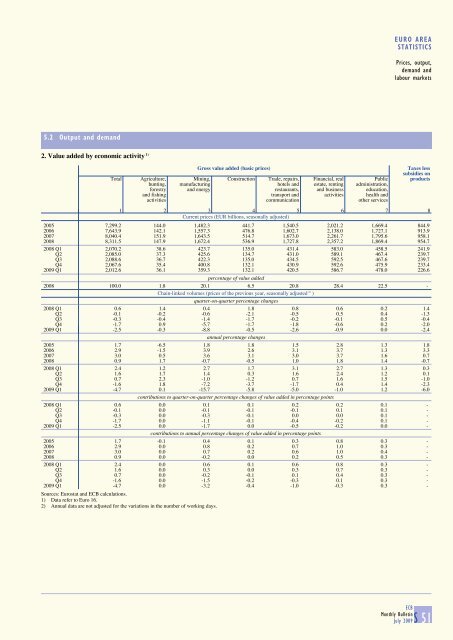
5.2 Output and <strong>de</strong>mand<br />
2. Value ad<strong>de</strong>d by economic activity 1)<br />
Gross value ad<strong>de</strong>d (basic prices)<br />
Taxes less<br />
subsidies on<br />
Total Agriculture, Mining, Construction Tra<strong>de</strong>, repairs, Financial, real Public products<br />
hunting, manufacturing hotels and estate, renting administration,<br />
forestry and energy restaurants, and business education,<br />
and fishing transport and activities health and<br />
activities communication other services<br />
1 2 3 4 5 6 7 8<br />
Current prices (EUR billions, seasonally adjusted)<br />
2005 7,299.2 144.0 1,482.3 441.7 1,540.5 2,021.2 1,669.4 844.9<br />
2006 7,643.9 142.1 1,557.3 476.8 1,602.7 2,138.0 1,727.1 913.9<br />
2007 8,040.4 151.9 1,643.5 514.7 1,673.0 2,261.7 1,795.6 958.1<br />
2008 8,311.5 147.9 1,672.4 536.9 1,727.8 2,357.2 1,869.4 954.7<br />
2008 Q1 2,070.2 38.6 423.7 135.0 431.4 583.0 458.5 241.9<br />
Q2 2,085.0 37.3 425.6 134.7 431.0 589.1 467.4 239.7<br />
Q3 2,088.6 36.7 422.3 135.0 434.5 592.5 467.6 239.7<br />
Q4 2,067.6 35.4 400.8 132.1 430.9 592.6 475.9 233.4<br />
<strong>2009</strong> Q1 2,012.6 36.1 359.3 132.1 420.5 586.7 478.0 226.6<br />
percentage of value ad<strong>de</strong>d<br />
2008 100.0 1.8 20.1 6.5 20.8 28.4 22.5 -<br />
Chain-linked volumes (prices of the previous year, seasonally adjusted 2) )<br />
quarter-on-quarter percentage changes<br />
2008 Q1 0.6 1.4 0.4 1.8 0.8 0.6 0.2 1.4<br />
Q2 -0.1 -0.2 -0.6 -2.1 -0.5 0.5 0.4 -1.3<br />
Q3 -0.3 -0.4 -1.4 -1.7 -0.2 -0.1 0.5 -0.4<br />
Q4 -1.7 0.9 -5.7 -1.7 -1.8 -0.6 0.2 -2.0<br />
<strong>2009</strong> Q1 -2.5 -0.3 -8.8 -0.5 -2.6 -0.9 0.0 -2.4<br />
annual percentage changes<br />
2005 1.7 -6.5 1.8 1.8 1.5 2.8 1.3 1.8<br />
2006 2.9 -1.5 3.9 2.6 3.1 3.7 1.3 3.3<br />
2007 3.0 0.5 3.6 3.1 3.0 3.7 1.6 0.7<br />
2008 0.9 1.7 -0.7 -0.5 1.0 1.8 1.4 -0.7<br />
2008 Q1 2.4 1.2 2.7 1.7 3.1 2.7 1.3 0.3<br />
Q2 1.6 1.7 1.4 0.3 1.6 2.4 1.2 0.1<br />
Q3 0.7 2.3 -1.0 -1.2 0.7 1.6 1.5 -1.0<br />
Q4 -1.6 1.8 -7.2 -3.7 -1.7 0.4 1.4 -2.3<br />
<strong>2009</strong> Q1 -4.7 0.1 -15.7 -5.8 -5.0 -1.0 1.2 -6.0<br />
contributions to quarter-on-quarter percentage changes of value ad<strong>de</strong>d in percentage points<br />
2008 Q1 0.6 0.0 0.1 0.1 0.2 0.2 0.1 -<br />
Q2 -0.1 0.0 -0.1 -0.1 -0.1 0.1 0.1 -<br />
Q3 -0.3 0.0 -0.3 -0.1 0.0 0.0 0.1 -<br />
Q4 -1.7 0.0 -1.1 -0.1 -0.4 -0.2 0.1 -<br />
<strong>2009</strong> Q1 -2.5 0.0 -1.7 0.0 -0.5 -0.2 0.0 -<br />
contributions to annual percentage changes of value ad<strong>de</strong>d in percentage points<br />
2005 1.7 -0.1 0.4 0.1 0.3 0.8 0.3 -<br />
2006 2.9 0.0 0.8 0.2 0.7 1.0 0.3 -<br />
2007 3.0 0.0 0.7 0.2 0.6 1.0 0.4 -<br />
2008 0.9 0.0 -0.2 0.0 0.2 0.5 0.3 -<br />
2008 Q1 2.4 0.0 0.6 0.1 0.6 0.8 0.3 -<br />
Q2 1.6 0.0 0.3 0.0 0.3 0.7 0.3 -<br />
Q3 0.7 0.0 -0.2 -0.1 0.1 0.4 0.3 -<br />
Q4 -1.6 0.0 -1.5 -0.2 -0.3 0.1 0.3 -<br />
<strong>2009</strong> Q1 -4.7 0.0 -3.2 -0.4 -1.0 -0.3 0.3 -<br />
Sources: Eurostat and ECB calculations.<br />
1) Data refer to Euro 16.<br />
2) Annual data are not adjusted for the variations in the number of working days.<br />
ECB<br />
<strong>Monthly</strong> <strong>Bulletin</strong><br />
<strong>July</strong> <strong>2009</strong>S 51


