

Monthly Bulletin July 2009 - Banque de France
Monthly Bulletin July 2009 - Banque de France
Monthly Bulletin July 2009 - Banque de France

You also want an ePaper? Increase the reach of your titles
YUMPU automatically turns print PDFs into web optimized ePapers that Google loves.
From the geographical breakdown of euro area goods tra<strong>de</strong>, it emerges that in the first quarter<br />
of <strong>2009</strong> exports to Asia and the OPEC countries appear to have reboun<strong>de</strong>d somewhat, while exports<br />
to the United Kingdom and the United States seem to have stabilised at low levels. However, these<br />
positive <strong>de</strong>velopments were overcompensated by the contraction of euro area exports to the rest<br />
of Europe. In terms of broad categories of goods, the most significant <strong>de</strong>clines in export volumes<br />
in the first quarter of <strong>2009</strong> continued to be for capital and intermediate goods, which fell back to<br />
levels not observed since 2004. Import volumes of capital and intermediate goods also experienced<br />
particularly severe <strong>de</strong>clines.<br />
Turning to the other components of the current account, the surplus in services <strong>de</strong>creased to<br />
€35.2 billion in the year to April <strong>2009</strong> – from €52.0 billion a year earlier. Over the same period,<br />
the <strong>de</strong>ficit in the income account wi<strong>de</strong>ned from €9.7 billion to €32.5 billion, resulting largely from<br />
lower income receipts from non-euro area resi<strong>de</strong>nts. Finally, the <strong>de</strong>ficit in current transfers also<br />
increased somewhat.<br />
FINANCIAL ACCOUNT<br />
In the three-month period to April <strong>2009</strong>, combined direct and portfolio investment recor<strong>de</strong>d average<br />
monthly net inflows of €34.7 billion, compared with net outflows of €10.8 billion over the previous<br />
three-month period (see Table 7). These <strong>de</strong>velopments were primarily due to <strong>de</strong>velopments in portfolio<br />
investment, where net inflows in bonds and notes increased from €15.7 billion to €34.8 billion. This<br />
<strong>de</strong>velopment was driven mainly by robust net purchases of euro area bonds by non-euro area resi<strong>de</strong>nts,<br />
possibly due in part to an attenuation of investors’ preferences for more liquid and shorter-term<br />
assets. In<strong>de</strong>ed, net investment in money market instruments remained largely unchanged, posting<br />
a €16.4 billion net inflow in the three-month period ending in April <strong>2009</strong>. Meanwhile, equity<br />
investment recor<strong>de</strong>d net outflows of €5.9 billion over the same period, as opposed to net outflows of<br />
€11.3 over the previous three months.<br />
Turning to net direct investment, both foreign<br />
direct investment abroad by euro area resi<strong>de</strong>nts<br />
and foreign direct investment in the euro area<br />
by non-resi<strong>de</strong>nts reboun<strong>de</strong>d in the three-month<br />
period to April <strong>2009</strong>, possibly signalling<br />
global strategies of market consolidation. As<br />
foreign direct investment in the euro area by<br />
non-resi<strong>de</strong>nts increased more than foreign direct<br />
investment abroad by euro area resi<strong>de</strong>nts, net<br />
outflows of direct investment fell to €10.6 billion<br />
over the period, down from €30.6 billion over<br />
the previous three-month period.<br />
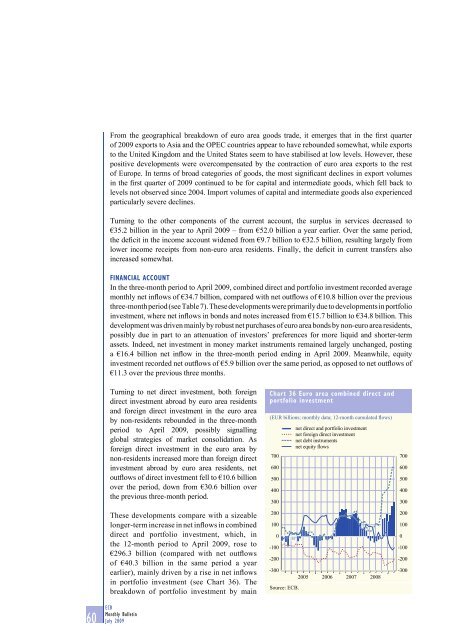
Chart 36 Euro area combined direct and<br />
portfolio investment<br />
(EUR billions; monthly data; 12-month cumulated flows)<br />
700<br />
600<br />
500<br />
400<br />
300<br />
net direct and portfolio investment<br />
net foreign direct investment<br />
net <strong>de</strong>bt instruments<br />
net equity flows<br />
700<br />
600<br />
500<br />
400<br />
300<br />
These <strong>de</strong>velopments compare with a sizeable<br />
longer-term increase in net inflows in combined<br />
direct and portfolio investment, which, in<br />
the 12-month period to April <strong>2009</strong>, rose to<br />
€296.3 billion (compared with net outflows<br />
of €40.3 billion in the same period a year<br />
earlier), mainly driven by a rise in net inflows<br />
in portfolio investment (see Chart 36). The<br />
breakdown of portfolio investment by main<br />
200<br />
100<br />
0<br />
-100<br />
-200<br />
-300<br />
2005 2006 2007<br />
Source: ECB.<br />
2008<br />
200<br />
100<br />
0<br />
-100<br />
-200<br />
-300<br />
60 ECB<br />
<strong>Monthly</strong> <strong>Bulletin</strong><br />
<strong>July</strong> <strong>2009</strong>


