

Monthly Bulletin July 2009 - Banque de France
Monthly Bulletin July 2009 - Banque de France
Monthly Bulletin July 2009 - Banque de France

You also want an ePaper? Increase the reach of your titles
YUMPU automatically turns print PDFs into web optimized ePapers that Google loves.
ECONOMIC<br />
AND MONETARY<br />
DEVELOPMENTS<br />
Prices and<br />
costs<br />
Chart 21 Breakdown of industrial producer<br />
prices<br />
(annual percentage changes; monthly data)<br />
Chart 22 Producer input and output price<br />
surveys<br />
(diffusion indices; monthly data)<br />
total industry excluding construction (left-hand scale)<br />
intermediate goods (left-hand scale)<br />
capital goods (left-hand scale)<br />
consumer goods (left-hand scale)<br />
energy (right-hand scale)<br />
manufacturing; input prices<br />
manufacturing; prices charged<br />
services; input prices<br />
services; prices charged<br />
10<br />
30<br />
80<br />
80<br />
8<br />
6<br />
24<br />
18<br />
70<br />
70<br />
4<br />
12<br />
60<br />
60<br />
2<br />
6<br />
50<br />
50<br />
0<br />
-2<br />
0<br />
-6<br />
40<br />
40<br />
-4<br />
-12<br />
30<br />
30<br />
-6<br />
2004 2005 2006 2007<br />
2008<br />
Sources: Eurostat and ECB calculations.<br />
Note: Data refer to the euro area including Slovakia.<br />
-18<br />
20<br />
2004 2005 2006 2007 2008<br />
Source: Markit.<br />
Note: An in<strong>de</strong>x value above 50 indicates an increase in prices,<br />
whereas a value below 50 indicates a <strong>de</strong>crease.<br />
20<br />
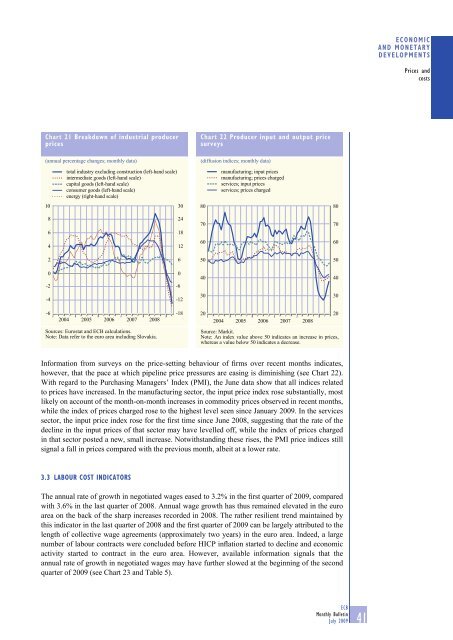
Information from surveys on the price-setting behaviour of firms over recent months indicates,<br />
however, that the pace at which pipeline price pressures are easing is diminishing (see Chart 22).<br />
With regard to the Purchasing Managers’ In<strong>de</strong>x (PMI), the June data show that all indices related<br />
to prices have increased. In the manufacturing sector, the input price in<strong>de</strong>x rose substantially, most<br />
likely on account of the month-on-month increases in commodity prices observed in recent months,<br />
while the in<strong>de</strong>x of prices charged rose to the highest level seen since January <strong>2009</strong>. In the services<br />
sector, the input price in<strong>de</strong>x rose for the first time since June 2008, suggesting that the rate of the<br />
<strong>de</strong>cline in the input prices of that sector may have levelled off, while the in<strong>de</strong>x of prices charged<br />
in that sector posted a new, small increase. Notwithstanding these rises, the PMI price indices still<br />
signal a fall in prices compared with the previous month, albeit at a lower rate.<br />
3.3 LABOUR COST INDICATORS<br />
The annual rate of growth in negotiated wages eased to 3.2% in the first quarter of <strong>2009</strong>, compared<br />
with 3.6% in the last quarter of 2008. Annual wage growth has thus remained elevated in the euro<br />
area on the back of the sharp increases recor<strong>de</strong>d in 2008. The rather resilient trend maintained by<br />
this indicator in the last quarter of 2008 and the first quarter of <strong>2009</strong> can be largely attributed to the<br />
length of collective wage agreements (approximately two years) in the euro area. In<strong>de</strong>ed, a large<br />
number of labour contracts were conclu<strong>de</strong>d before HICP inflation started to <strong>de</strong>cline and economic<br />
activity started to contract in the euro area. However, available information signals that the<br />
annual rate of growth in negotiated wages may have further slowed at the beginning of the second<br />
quarter of <strong>2009</strong> (see Chart 23 and Table 5).<br />
ECB<br />
<strong>Monthly</strong> <strong>Bulletin</strong><br />
<strong>July</strong> <strong>2009</strong><br />
41


