

Monthly Bulletin July 2009 - Banque de France
Monthly Bulletin July 2009 - Banque de France
Monthly Bulletin July 2009 - Banque de France

You also want an ePaper? Increase the reach of your titles
YUMPU automatically turns print PDFs into web optimized ePapers that Google loves.
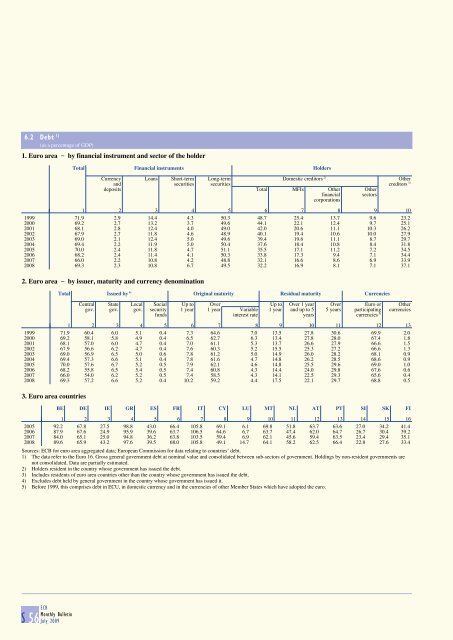
6.2 Debt 1)<br />
(as a percentage of GDP)<br />
1. Euro area _ by financial instrument and sector of the hol<strong>de</strong>r<br />
Total Financial instruments Hol<strong>de</strong>rs<br />
Currency Loans Short-term Long-term Domestic creditors 2) Other<br />
and securities securities creditors 3)<br />
<strong>de</strong>posits Total MFIs Other Other<br />
financial sectors<br />
corporations<br />
1 2 3 4 5 6 7 8 9 10<br />
1999 71.9 2.9 14.4 4.3 50.3 48.7 25.4 13.7 9.6 23.2<br />
2000 69.2 2.7 13.2 3.7 49.6 44.1 22.1 12.4 9.7 25.1<br />
2001 68.1 2.8 12.4 4.0 49.0 42.0 20.6 11.1 10.3 26.2<br />
2002 67.9 2.7 11.8 4.6 48.9 40.1 19.4 10.6 10.0 27.9<br />
2003 69.0 2.1 12.4 5.0 49.6 39.4 19.6 11.1 8.7 29.7<br />
2004 69.4 2.2 11.9 5.0 50.4 37.6 18.4 10.8 8.4 31.8<br />
2005 70.0 2.4 11.8 4.7 51.1 35.5 17.1 11.2 7.2 34.5<br />
2006 68.2 2.4 11.4 4.1 50.3 33.8 17.3 9.4 7.1 34.4<br />
2007 66.0 2.2 10.8 4.2 48.8 32.1 16.6 8.6 6.9 33.9<br />
2008 69.3 2.3 10.8 6.7 49.5 32.2 16.9 8.1 7.1 37.1<br />
2. Euro area _ by issuer, maturity and currency <strong>de</strong>nomination<br />
Total Issued by 4) Original maturity Residual maturity Currencies<br />
Central State Local Social Up to Over Up to Over 1 year Over Euro or Other<br />
gov. gov. gov. security 1 year 1 year Variable 1 year and up to 5 5 years participating currencies<br />
funds interest rate years currencies 5)<br />
1 2 3 4 5 6 7 8 9 10 11 12 13<br />
1999 71.9 60.4 6.0 5.1 0.4 7.3 64.6 7.0 13.5 27.8 30.6 69.9 2.0<br />
2000 69.2 58.1 5.8 4.9 0.4 6.5 62.7 6.3 13.4 27.8 28.0 67.4 1.8<br />
2001 68.1 57.0 6.0 4.7 0.4 7.0 61.1 5.3 13.7 26.6 27.9 66.6 1.5<br />
2002 67.9 56.6 6.2 4.7 0.4 7.6 60.3 5.2 15.5 25.3 27.2 66.6 1.3<br />
2003 69.0 56.9 6.5 5.0 0.6 7.8 61.2 5.0 14.9 26.0 28.2 68.1 0.9<br />
2004 69.4 57.3 6.6 5.1 0.4 7.8 61.6 4.7 14.8 26.2 28.5 68.6 0.9<br />
2005 70.0 57.6 6.7 5.2 0.5 7.9 62.1 4.6 14.8 25.5 29.6 69.0 1.0<br />
2006 68.2 55.8 6.5 5.4 0.5 7.4 60.8 4.3 14.4 24.0 29.8 67.6 0.6<br />
2007 66.0 54.0 6.2 5.2 0.5 7.4 58.5 4.3 14.1 22.5 29.3 65.6 0.4<br />
2008 69.3 57.2 6.6 5.2 0.4 10.2 59.2 4.4 17.5 22.1 29.7 68.8 0.5<br />
3. Euro area countries<br />
BE DE IE GR ES FR IT CY LU MT NL AT PT SI SK FI<br />
1 2 3 4 5 6 7 8 9 10 11 12 13 14 15 16<br />
2005 92.2 67.8 27.5 98.8 43.0 66.4 105.8 69.1 6.1 69.8 51.8 63.7 63.6 27.0 34.2 41.4<br />
2006 87.9 67.6 24.9 95.9 39.6 63.7 106.5 64.6 6.7 63.7 47.4 62.0 64.7 26.7 30.4 39.2<br />
2007 84.0 65.1 25.0 94.8 36.2 63.8 103.5 59.4 6.9 62.1 45.6 59.4 63.5 23.4 29.4 35.1<br />
2008 89.6 65.9 43.2 97.6 39.5 68.0 105.8 49.1 14.7 64.1 58.2 62.5 66.4 22.8 27.6 33.4<br />
Sources: ECB for euro area aggregated data; European Commission for data relating to countries’ <strong>de</strong>bt.<br />
1) The data refer to the Euro 16. Gross general government <strong>de</strong>bt at nominal value and consolidated between sub-sectors of government. Holdings by non-resi<strong>de</strong>nt governments are<br />
not consolidated. Data are partially estimated.<br />
2) Hol<strong>de</strong>rs resi<strong>de</strong>nt in the country whose government has issued the <strong>de</strong>bt.<br />
3) Inclu<strong>de</strong>s resi<strong>de</strong>nts of euro area countries other than the country whose government has issued the <strong>de</strong>bt.<br />
4) Exclu<strong>de</strong>s <strong>de</strong>bt held by general government in the country whose government has issued it.<br />
5) Before 1999, this comprises <strong>de</strong>bt in ECU, in domestic currency and in the currencies of other Member States which have adopted the euro.<br />
S 56 ECB<br />
<strong>Monthly</strong> <strong>Bulletin</strong><br />
<strong>July</strong> <strong>2009</strong>


