

Monthly Bulletin July 2009 - Banque de France
Monthly Bulletin July 2009 - Banque de France
Monthly Bulletin July 2009 - Banque de France

You also want an ePaper? Increase the reach of your titles
YUMPU automatically turns print PDFs into web optimized ePapers that Google loves.
ECONOMIC<br />
AND MONETARY<br />
DEVELOPMENTS<br />
Monetary and<br />
financial<br />
<strong>de</strong>velopments<br />
months of <strong>2009</strong>. However, for some countries with credit ratings lower than triple-A, spreads<br />
wi<strong>de</strong>ned again. This might reflect continued elevated risk aversion among investors in the bond<br />
market and concerns about the fiscal sustainability of increasing government <strong>de</strong>bt (for a longerterm<br />
perspective on <strong>de</strong>velopments in intra-euro area government bond spreads and their US<br />
counterparts, see Box 2).<br />
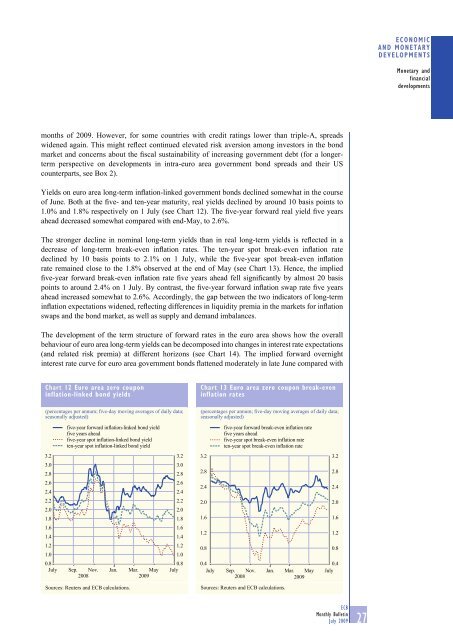
Yields on euro area long-term inflation-linked government bonds <strong>de</strong>clined somewhat in the course<br />
of June. Both at the five- and ten-year maturity, real yields <strong>de</strong>clined by around 10 basis points to<br />
1.0% and 1.8% respectively on 1 <strong>July</strong> (see Chart 12). The five-year forward real yield five years<br />
ahead <strong>de</strong>creased somewhat compared with end-May, to 2.6%.<br />
The stronger <strong>de</strong>cline in nominal long-term yields than in real long-term yields is reflected in a<br />
<strong>de</strong>crease of long-term break-even inflation rates. The ten-year spot break-even inflation rate<br />
<strong>de</strong>clined by 10 basis points to 2.1% on 1 <strong>July</strong>, while the five-year spot break-even inflation<br />
rate remained close to the 1.8% observed at the end of May (see Chart 13). Hence, the implied<br />
five-year forward break-even inflation rate five years ahead fell significantly by almost 20 basis<br />
points to around 2.4% on 1 <strong>July</strong>. By contrast, the five-year forward inflation swap rate five years<br />
ahead increased somewhat to 2.6%. Accordingly, the gap between the two indicators of long-term<br />
inflation expectations wi<strong>de</strong>ned, reflecting differences in liquidity premia in the markets for inflation<br />
swaps and the bond market, as well as supply and <strong>de</strong>mand imbalances.<br />
The <strong>de</strong>velopment of the term structure of forward rates in the euro area shows how the overall<br />
behaviour of euro area long-term yields can be <strong>de</strong>composed into changes in interest rate expectations<br />
(and related risk premia) at different horizons (see Chart 14). The implied forward overnight<br />
interest rate curve for euro area government bonds flattened mo<strong>de</strong>rately in late June compared with<br />
Chart 12 Euro area zero coupon<br />
inflation-linked bond yields<br />
(percentages per annum; five-day moving averages of daily data;<br />
seasonally adjusted)<br />
Chart 13 Euro area zero coupon break-even<br />
inflation rates<br />
(percentages per annum; five-day moving averages of daily data;<br />
seasonally adjusted)<br />
five-year forward inflation-linked bond yield<br />
five years ahead<br />
five-year spot inflation-linked bond yield<br />
ten-year spot inflation-linked bond yield<br />
five-year forward break-even inflation rate<br />
five years ahead<br />
five-year spot break-even inflation rate<br />
ten-year spot break-even inflation rate<br />
3.2<br />
3.0<br />
2.8<br />
3.2<br />
3.0<br />
2.8<br />
3.2<br />
2.8<br />
3.2<br />
2.8<br />
2.6<br />
2.4<br />
2.6<br />
2.4<br />
2.4<br />
2.4<br />
2.2<br />
2.0<br />
1.8<br />
2.2<br />
2.0<br />
1.8<br />
2.0<br />
1.6<br />
2.0<br />
1.6<br />
1.6<br />
1.4<br />
1.6<br />
1.4<br />
1.2<br />
1.2<br />
1.2<br />
1.0<br />
0.8<br />
<strong>July</strong><br />
Sep. Nov. Jan. Mar. May<br />
2008 <strong>2009</strong><br />
1.2<br />
1.0<br />
0.8<br />
<strong>July</strong><br />
0.8<br />
0.4<br />
0.4<br />
<strong>July</strong> Sep. Nov. Jan. Mar. May <strong>July</strong><br />
2008 <strong>2009</strong><br />
0.8<br />
Sources: Reuters and ECB calculations.<br />
Sources: Reuters and ECB calculations.<br />
ECB<br />
<strong>Monthly</strong> <strong>Bulletin</strong><br />
<strong>July</strong> <strong>2009</strong><br />
27


