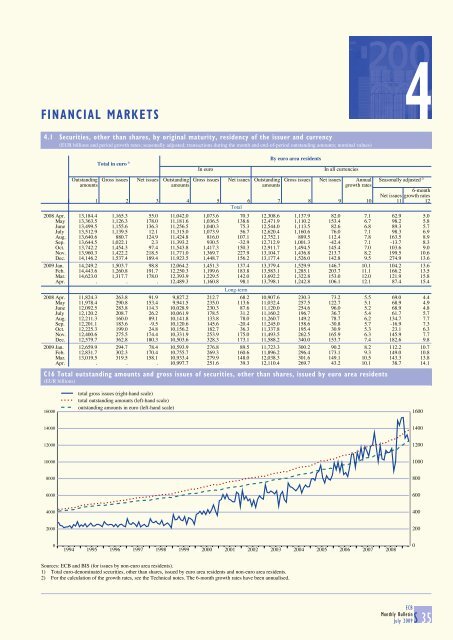
FINANCIAL MARKETS 4 4.1 Securities, other than shares, by original maturity, resi<strong>de</strong>ncy of the issuer and currency (EUR billions and period growth rates; seasonally adjusted; transactions during the month and end-of-period outstanding amounts; nominal values) Total in euro 1) By euro area resi<strong>de</strong>nts In euro In all currencies Outstanding Gross issues Net issues Outstanding Gross issues Net issues Outstanding Gross issues Net issues Annual Seasonally adjusted 2) amounts amounts amounts growth rates 6-month Net issues growth rates 1 2 3 4 5 6 7 8 9 10 11 12 Total 2008 Apr. 13,184.4 1,165.3 55.0 11,042.0 1,073.6 70.3 12,308.6 1,137.9 82.0 7.1 62.9 5.0 May 13,363.5 1,126.3 178.0 11,181.6 1,036.5 138.6 12,471.9 1,110.2 153.4 6.7 98.2 5.8 June 13,499.5 1,155.6 136.3 11,256.5 1,040.3 75.3 12,544.0 1,113.5 82.6 6.8 89.3 5.7 <strong>July</strong> 13,512.9 1,139.5 12.1 11,315.0 1,073.9 56.7 12,620.4 1,160.6 76.0 7.1 98.3 6.9 Aug. 13,640.6 880.7 124.9 11,424.8 816.0 107.1 12,752.1 889.5 112.4 7.8 163.5 8.9 Sep. 13,644.5 1,022.1 2.3 11,393.2 930.5 -32.9 12,712.9 1,001.3 -42.4 7.1 -13.7 8.3 Oct. 13,742.2 1,454.3 97.4 11,543.8 1,417.3 150.3 12,911.7 1,494.5 145.4 7.0 103.6 9.0 Nov. 13,960.3 1,422.2 218.5 11,771.0 1,369.7 227.9 13,104.7 1,436.8 213.7 8.2 199.5 10.6 Dec. 14,146.2 1,537.4 189.4 11,923.5 1,448.7 156.2 13,177.4 1,526.0 142.8 9.5 274.9 13.6 <strong>2009</strong> Jan. 14,249.2 1,503.7 98.8 12,064.2 1,451.3 137.4 13,379.4 1,529.9 146.7 10.1 104.2 13.6 Feb. 14,443.6 1,260.8 191.7 12,250.3 1,199.6 183.8 13,583.1 1,285.1 203.7 11.1 166.2 13.5 Mar. 14,623.0 1,317.7 178.0 12,393.9 1,229.5 142.0 13,692.2 1,322.8 153.0 12.0 121.9 15.8 Apr. . . . 12,489.3 1,160.8 98.1 13,798.1 1,242.8 106.1 12.1 87.4 15.4 Long-term 2008 Apr. 11,824.3 263.8 91.9 9,827.2 212.7 68.2 10,907.6 230.3 73.2 5.5 69.0 4.4 May 11,978.4 290.8 153.4 9,941.5 235.0 113.6 11,032.4 257.5 122.7 5.1 68.9 4.9 June 12,092.5 283.8 114.3 10,028.9 230.3 87.6 11,120.0 254.6 96.0 5.2 68.9 4.8 <strong>July</strong> 12,120.2 208.7 26.2 10,061.9 178.5 31.2 11,160.2 196.7 36.7 5.4 61.7 5.7 Aug. 12,211.3 160.0 89.1 10,141.8 133.8 78.0 11,260.7 149.2 78.7 6.2 134.7 7.7 Sep. 12,201.1 183.6 -9.5 10,120.6 145.6 -20.4 11,245.0 158.6 -30.8 5.7 -16.9 7.3 Oct. 12,225.3 199.0 24.8 10,156.2 182.7 36.3 11,337.8 195.4 30.9 5.3 23.1 6.3 Nov. 12,400.6 275.5 174.4 10,331.9 253.9 175.0 11,493.5 262.5 165.9 6.3 145.9 7.7 Dec. 12,579.7 362.8 180.3 10,503.6 328.3 173.1 11,588.2 340.0 153.7 7.4 182.6 9.8 <strong>2009</strong> Jan. 12,659.9 294.7 78.4 10,593.9 276.8 89.5 11,723.3 300.2 90.2 8.2 112.2 10.7 Feb. 12,831.7 302.3 170.4 10,755.7 269.3 160.6 11,896.2 296.4 173.1 9.3 149.0 10.8 Mar. 13,019.5 319.5 158.1 10,933.4 279.9 148.0 12,038.3 301.6 149.1 10.5 143.3 13.8 Apr. . . . 10,997.7 251.6 39.3 12,110.4 269.7 43.2 10.1 38.7 14.1 C16 Total outstanding amounts and gross issues of securities, other than shares, issued by euro area resi<strong>de</strong>nts (EUR billions) 16000 total gross issues (right-hand scale) total outstanding amounts (left-hand scale) outstanding amounts in euro (left-hand scale) 1600 14000 1400 12000 1200 10000 1000 8000 800 6000 600 4000 400 2000 200 0 1994 1995 1996 1997 1998 1999 2000 2001 2002 2003 2004 2005 2006 2007 2008 0 Sources: ECB and BIS (for issues by non-euro area resi<strong>de</strong>nts). 1) Total euro-<strong>de</strong>nominated securities, other than shares, issued by euro area resi<strong>de</strong>nts and non-euro area resi<strong>de</strong>nts. 2) For the calculation of the growth rates, see the Technical notes. The 6-month growth rates have been annualised. ECB <strong>Monthly</strong> <strong>Bulletin</strong> <strong>July</strong> <strong>2009</strong>S 35
4.2 Securities, other than shares, issued by euro area resi<strong>de</strong>nts, by sector of the issuer and instrument type (EUR billions ; transactions during the month and end-of-period outstanding amounts; nominal values) 1. Outstanding amounts and gross issues Outstanding amounts Gross issues 1) Total MFIs Non-MFI corporations General government Total MFIs Non-MFI corporations General government (including (including Eurosystem) Financial Non-financial Central Other Eurosystem) Financial Non-financial Central Other corporations corporations government general corporations corporations government general other than government other than government MFIs MFIs 1 2 3 4 5 6 7 8 9 10 11 12 Total 2007 12,069 5,046 1,510 653 4,534 327 1,138 841 59 109 116 12 2008 13,177 5,266 1,925 696 4,950 340 1,177 817 73 100 163 24 2008 Q2 12,544 5,231 1,627 670 4,696 320 1,121 787 70 102 142 20 Q3 12,713 5,267 1,695 680 4,747 324 1,017 691 54 97 148 27 Q4 13,177 5,266 1,925 696 4,950 340 1,486 1,006 132 107 214 28 <strong>2009</strong> Q1 13,692 5,395 2,008 718 5,228 343 1,379 922 68 92 261 35 <strong>2009</strong> Jan. 13,379 5,340 1,944 710 5,048 337 1,530 1,016 75 105 278 56 Feb. 13,583 5,407 1,988 718 5,133 338 1,285 873 72 81 236 23 Mar. 13,692 5,395 2,008 718 5,228 343 1,323 878 58 90 269 27 Apr. 13,798 5,419 2,033 728 5,267 350 1,243 805 55 90 266 26 Short-term 2007 1,287 787 36 100 345 18 946 754 18 101 64 9 2008 1,589 822 61 115 566 25 962 723 26 92 101 19 2008 Q2 1,424 835 51 111 415 11 873 666 21 92 77 17 Q3 1,468 826 62 111 457 13 849 614 25 92 94 24 Q4 1,589 822 61 115 566 25 1,220 911 38 95 152 23 <strong>2009</strong> Q1 1,654 838 41 98 659 18 1,080 806 17 74 156 27 <strong>2009</strong> Jan. 1,656 862 38 108 630 19 1,230 905 18 82 178 47 Feb. 1,687 884 38 103 643 19 989 748 16 67 140 18 Mar. 1,654 838 41 98 659 18 1,021 764 17 74 149 17 Apr. 1,688 829 42 94 705 17 973 694 16 74 173 16 Long-term 2) 2007 10,782 4,259 1,473 553 4,189 309 191 86 41 8 52 3 2008 11,588 4,445 1,864 581 4,384 315 215 95 47 8 62 4 2008 Q2 11,120 4,397 1,576 558 4,280 309 247 121 48 10 65 3 Q3 11,245 4,442 1,633 570 4,290 311 168 76 29 5 54 3 Q4 11,588 4,445 1,864 581 4,384 315 266 95 93 11 62 5 <strong>2009</strong> Q1 12,038 4,556 1,967 621 4,570 324 299 116 51 18 105 8 <strong>2009</strong> Jan. 11,723 4,479 1,906 602 4,419 319 300 111 56 23 100 9 Feb. 11,896 4,523 1,949 615 4,490 319 296 125 56 15 95 6 Mar. 12,038 4,556 1,967 621 4,570 324 302 114 42 16 120 10 Apr. 12,110 4,590 1,991 634 4,562 333 270 111 40 16 93 10 Of which long-term fixed rate 2007 7,324 2,263 594 419 3,797 250 107 44 10 5 45 3 2008 7,611 2,326 625 445 3,966 250 119 48 8 6 54 3 2008 Q2 7,477 2,347 605 424 3,853 248 145 66 11 9 56 2 Q3 7,535 2,370 619 432 3,865 248 101 42 7 3 47 2 Q4 7,611 2,326 625 445 3,966 250 120 42 9 10 57 2 <strong>2009</strong> Q1 7,932 2,397 663 487 4,133 252 207 72 17 18 96 5 <strong>2009</strong> Jan. 7,712 2,349 644 467 4,002 251 214 76 18 23 92 6 Feb. 7,839 2,384 661 479 4,065 250 203 76 22 15 86 4 Mar. 7,932 2,397 663 487 4,133 252 205 65 11 15 108 6 Apr. 7,983 2,421 673 500 4,131 258 185 63 15 15 85 7 Of which long-term variable rate 2007 3,004 1,621 861 123 342 58 69 31 30 3 4 0 2008 3,489 1,724 1,209 126 365 64 81 36 38 1 5 1 2008 Q2 3,186 1,683 945 124 373 60 90 47 36 1 6 1 Q3 3,238 1,698 987 129 362 61 53 24 21 2 4 1 Q4 3,489 1,724 1,209 126 365 64 129 39 83 1 3 2 <strong>2009</strong> Q1 3,603 1,759 1,279 123 371 70 75 32 34 0 5 3 <strong>2009</strong> Jan. 3,508 1,724 1,234 125 359 66 63 19 37 0 3 3 Feb. 3,549 1,731 1,261 125 365 68 80 38 34 0 6 2 Mar. 3,603 1,759 1,279 123 371 70 81 40 30 1 7 4 Apr. 3,613 1,762 1,292 124 362 73 66 35 23 1 5 3 Source: ECB. 1) <strong>Monthly</strong> averages of/monthly data for the transactions during this period. 2) The residual difference between total long-term <strong>de</strong>bt securities and fixed and variable rate long-term <strong>de</strong>bt securities consists of zero coupon bonds and revaluation effects. S 36 ECB <strong>Monthly</strong> <strong>Bulletin</strong> <strong>July</strong> <strong>2009</strong>
- Page 1 and 2:
EN 0712009 EUROPEAN CENTRAL BANK MO
- Page 3 and 4:
© European Central Bank 2009 Addre
- Page 5 and 6:
ABBREVIATIONS COUNTRIES LU Luxembou
- Page 7 and 8:
Risks to the outlook for inflation
- Page 10 and 11:
ECONOMIC AND MONETARY DEVELOPMENTS
- Page 12 and 13:
ECONOMIC AND MONETARY DEVELOPMENTS
- Page 14 and 15:
ECONOMIC AND MONETARY DEVELOPMENTS
- Page 16 and 17:
ECONOMIC AND MONETARY DEVELOPMENTS
- Page 18 and 19:
ECONOMIC AND MONETARY DEVELOPMENTS
- Page 20 and 21:
ECONOMIC AND MONETARY DEVELOPMENTS
- Page 22 and 23:
ECONOMIC AND MONETARY DEVELOPMENTS
- Page 24 and 25:
ECONOMIC AND MONETARY DEVELOPMENTS
- Page 26 and 27:
ECONOMIC AND MONETARY DEVELOPMENTS
- Page 28 and 29:
ECONOMIC AND MONETARY DEVELOPMENTS
- Page 30 and 31:
ECONOMIC AND MONETARY DEVELOPMENTS
- Page 32 and 33:
ECONOMIC AND MONETARY DEVELOPMENTS
- Page 34 and 35:
ECONOMIC AND MONETARY DEVELOPMENTS
- Page 36 and 37:
ECONOMIC AND MONETARY DEVELOPMENTS
- Page 38 and 39:
ECONOMIC AND MONETARY DEVELOPMENTS
- Page 40 and 41:
ECONOMIC AND MONETARY DEVELOPMENTS
- Page 42 and 43:
ECONOMIC AND MONETARY DEVELOPMENTS
- Page 44 and 45:
ECONOMIC AND MONETARY DEVELOPMENTS
- Page 46 and 47:
ECONOMIC AND MONETARY DEVELOPMENTS
- Page 48 and 49:
ECONOMIC AND MONETARY DEVELOPMENTS
- Page 50 and 51:
ECONOMIC AND MONETARY DEVELOPMENTS
- Page 52 and 53:
ECONOMIC AND MONETARY DEVELOPMENTS
- Page 54 and 55:
ECONOMIC AND MONETARY DEVELOPMENTS
- Page 56 and 57:
ECONOMIC AND MONETARY DEVELOPMENTS
- Page 58 and 59:
ECONOMIC AND MONETARY DEVELOPMENTS
- Page 60 and 61:
ECONOMIC AND MONETARY DEVELOPMENTS
- Page 62 and 63:
ECONOMIC AND MONETARY DEVELOPMENTS
- Page 64 and 65:
ARTICLES THE IMPACT OF GOVERNMENT S
- Page 66 and 67:
others also take into account the r
- Page 68 and 69:
exceeds the market price, a capital
- Page 70 and 71:
4 THE IMPACT ON GOVERNMENT BOND YIE
- Page 72 and 73:
yield differential to Germany despi
- Page 74 and 75:
5 IMPLICATIONS FOR FISCAL SUSTAINAB
- Page 76 and 77:
THE IMPLEMENTATION OF MONETARY POLI
- Page 78 and 79:
to loans with shorter maturities to
- Page 80 and 81:
Chart 2 Average daily reserve surpl
- Page 82 and 83:
In pre-turmoil times, such allotmen
- Page 84 and 85:
Chart 5 US dollars provided by the
- Page 86 and 87: in Chart 7, which shows that lendin
- Page 88 and 89: Chart A The EONIA, the euro interba
- Page 90: euro-denominated covered bonds issu
- Page 93 and 94: Table 1 Two-group rotation system (
- Page 95 and 96: for each governor; (ii) transparenc
- Page 97 and 98: Chart C The three-group rotation sy
- Page 99 and 100: 7. The share of each national centr
- Page 102: EURO AREA STATISTICS ECB Monthly Bu
- Page 105 and 106: 6.3 Change in debt S57 6.4 Quarterl
- Page 107 and 108: 1 MONETARY POLICY STATISTICS 1.1 Co
- Page 109 and 110: 1), 2) 1.3 Eurosystem monetary poli
- Page 111 and 112: 2 MONEY, BANKING AND INVESTMENT FUN
- Page 113 and 114: 2.3 Monetary statistics 1) (EUR bil
- Page 115 and 116: 1), 2) 2.4 MFI loans, breakdown (EU
- Page 117 and 118: 1), 2) 2.4 MFI loans, breakdown (EU
- Page 119 and 120: 1), 2) 2.5 Deposits held with MFIs,
- Page 121 and 122: 1), 2) 2.6 MFI holdings of securiti
- Page 123 and 124: 2.8 Currency breakdown of selected
- Page 125 and 126: 2.9 Aggregated balance sheet of eur
- Page 127 and 128: 3 EURO AREA ACCOUNTS 3.1 Integrated
- Page 129 and 130: 3.1 Integrated economic and financi
- Page 131 and 132: 3.2 Euro area non-financial account
- Page 133 and 134: 3.3 Households (EUR billions; four-
- Page 135: 3.5 Insurance corporations and pens
- Page 139 and 140: 4.3 Growth rates of securities, oth
- Page 141 and 142: 4.4 Quoted shares issued by euro ar
- Page 143 and 144: 4.5 MFI interest rates on euro-deno
- Page 145 and 146: 4.6 Money market interest rates (pe
- Page 147 and 148: 4.8 Stock market indices (index lev
- Page 149 and 150: 5.1 HICP, other prices and costs (a
- Page 151 and 152: 5.2 Output and demand 1. GDP and ex
- Page 153 and 154: 5.2 Output and demand (annual perce
- Page 155 and 156: 5.3 Labour markets 1) (annual perce
- Page 157 and 158: 6.2 Debt 1) (as a percentage of GDP
- Page 159 and 160: 6.4 Quarterly revenue, expenditure
- Page 161 and 162: 7 EXTERNAL 7.1 Summary balance of p
- Page 163 and 164: 7.2 Current and capital accounts (E
- Page 165 and 166: 7.3 Financial account (EUR billions
- Page 167 and 168: 7.3 Financial account (EUR billions
- Page 169 and 170: 7.3 Financial account (EUR billions
- Page 171 and 172: 7.5 Trade in goods 1. Values and vo
- Page 173 and 174: 8 EXCHANGE 8.1 Effective exchange r
- Page 175 and 176: 9 DEVELOPMENTS 9.1 In other EU Memb
- Page 177 and 178: LIST OF CHARTS C1 Monetary aggregat
- Page 179 and 180: Growth rates for intra-annual perio
- Page 181 and 182: k) l) a t = ⎛ ⎜ −1⎟×100
- Page 184 and 185: GENERAL NOTES The “Euro area stat
- Page 186 and 187:
EURO AREA STATISTICS General notes
- Page 188 and 189:
EURO AREA STATISTICS General notes
- Page 190 and 191:
EURO AREA STATISTICS General notes
- Page 192 and 193:
EURO AREA STATISTICS General notes
- Page 194:
EURO AREA STATISTICS General notes
- Page 197 and 198:
oth the marginal lending facility a
- Page 200 and 201:
DOCUMENTS PUBLISHED BY THE EUROPEAN
- Page 202 and 203:
DOCUMENTS PUBLISHED 89 “An analys
- Page 204 and 205:
DOCUMENTS PUBLISHED “Euro area ba
- Page 206 and 207:
GLOSSARY This glossary contains sel
- Page 208 and 209:
GLOSSARY ERM II (exchange rate mech
- Page 210 and 211:
GLOSSARY Investment funds (except m
- Page 212:
GLOSSARY is determined on the basis