

Monthly Bulletin July 2009 - Banque de France
Monthly Bulletin July 2009 - Banque de France
Monthly Bulletin July 2009 - Banque de France

You also want an ePaper? Increase the reach of your titles
YUMPU automatically turns print PDFs into web optimized ePapers that Google loves.
Over the past three months the euro has <strong>de</strong>preciated against the Czech koruna (5.9%), the Hungarian<br />
forint (12%) and the Polish zloty (6.4%).<br />
OTHER CURRENCIES<br />
Between the end of March and mid-June <strong>2009</strong>, some large swings notwithstanding, the euro<br />
<strong>de</strong>preciated slightly against the Swiss franc. Since approximately the third week of June, however,<br />
the euro has appreciated sharply. The strengthening of the euro reportedly stemmed from<br />
interventions in the foreign exchange markets by the Swiss National Bank. On 1 <strong>July</strong> the euro<br />
tra<strong>de</strong>d at around CHF 1.52, 0.6% higher than its end-of-March level but 4% lower than its average<br />
in 2008. Between the end of March and 1 <strong>July</strong>, the euro weakened by 2.8% against the Canadian<br />
dollar, while it <strong>de</strong>preciated sharply, by 9%, against the Australian dollar.<br />
5.2 BALANCE OF PAYMENTS<br />
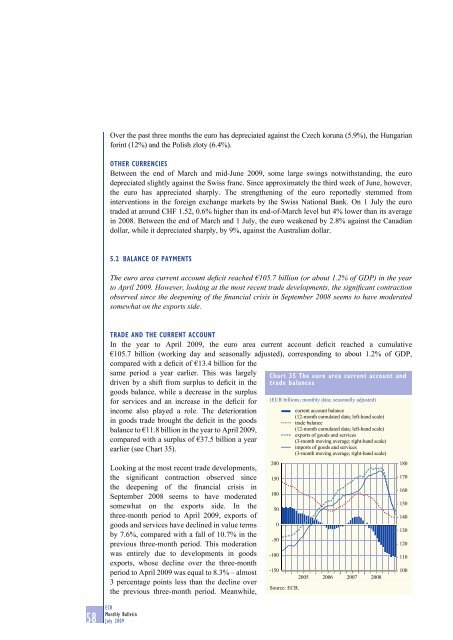
The euro area current account <strong>de</strong>fi cit reached €105.7 billion (or about 1.2% of GDP) in the year<br />
to April <strong>2009</strong>. However, looking at the most recent tra<strong>de</strong> <strong>de</strong>velopments, the signifi cant contraction<br />
observed since the <strong>de</strong>epening of the fi nancial crisis in September 2008 seems to have mo<strong>de</strong>rated<br />
somewhat on the exports si<strong>de</strong>.<br />
TRADE AND THE CURRENT ACCOUNT<br />
In the year to April <strong>2009</strong>, the euro area current account <strong>de</strong>ficit reached a cumulative<br />
€105.7 billion (working day and seasonally adjusted), corresponding to about 1.2% of GDP,<br />
compared with a <strong>de</strong>ficit of €13.4 billion for the<br />
same period a year earlier. This was largely<br />
driven by a shift from surplus to <strong>de</strong>ficit in the<br />
goods balance, while a <strong>de</strong>crease in the surplus<br />
for services and an increase in the <strong>de</strong>ficit for<br />
income also played a role. The <strong>de</strong>terioration<br />
in goods tra<strong>de</strong> brought the <strong>de</strong>ficit in the goods<br />
balance to €11.8 billion in the year to April <strong>2009</strong>,<br />
compared with a surplus of €37.5 billion a year<br />
earlier (see Chart 35).<br />
Looking at the most recent tra<strong>de</strong> <strong>de</strong>velopments,<br />
the significant contraction observed since<br />
the <strong>de</strong>epening of the financial crisis in<br />
September 2008 seems to have mo<strong>de</strong>rated<br />
somewhat on the exports si<strong>de</strong>. In the<br />
three-month period to April <strong>2009</strong>, exports of<br />
goods and services have <strong>de</strong>clined in value terms<br />
by 7.6%, compared with a fall of 10.7% in the<br />
previous three-month period. This mo<strong>de</strong>ration<br />
was entirely due to <strong>de</strong>velopments in goods<br />
exports, whose <strong>de</strong>cline over the three-month<br />
period to April <strong>2009</strong> was equal to 8.3% – almost<br />
3 percentage points less than the <strong>de</strong>cline over<br />
the previous three-month period. Meanwhile,<br />
58 ECB<br />
<strong>Monthly</strong> <strong>Bulletin</strong><br />
<strong>July</strong> <strong>2009</strong><br />
Chart 35 The euro area current account and<br />
tra<strong>de</strong> balances<br />
(EUR billions; monthly data; seasonally adjusted)<br />
200<br />
150<br />
100<br />
50<br />
0<br />
-50<br />
-100<br />
-150<br />
Source: ECB.<br />
current account balance<br />
(12-month cumulated data; left-hand scale)<br />
tra<strong>de</strong> balance<br />
(12-month cumulated data; left-hand scale)<br />
exports of goods and services<br />
(3-month moving average; right-hand scale)<br />
imports of goods and services<br />
(3-month moving average; right-hand scale)<br />
2005 2006 2007 2008<br />
180<br />
170<br />
160<br />
150<br />
140<br />
130<br />
120<br />
110<br />
100


