

Monthly Bulletin July 2009 - Banque de France
Monthly Bulletin July 2009 - Banque de France
Monthly Bulletin July 2009 - Banque de France

You also want an ePaper? Increase the reach of your titles
YUMPU automatically turns print PDFs into web optimized ePapers that Google loves.
EURO AREA<br />
STATISTICS<br />
External<br />
transactions<br />
and<br />
positions<br />
7.4 Monetary presentation of the balance of payments 1)<br />
(EUR billions; transactions)<br />
B.o.p. items balancing transactions in the external counterpart of M3<br />
Memo:<br />
Transactions<br />
Current and Direct investment Portfolio investment Other investment Financial Errors Total in the<br />
capital <strong>de</strong>rivatives and of external<br />
accounts By By non- Assets Liabilities Assets Liabilities omissions columns counterpart<br />
balance resi<strong>de</strong>nt resi<strong>de</strong>nt 1 to 10 of M3<br />
units units<br />
abroad in the Non-MFIs Equity 2) Debt Non-MFIs Non-MFIs<br />
(non-MFIs) euro area instruments 3)<br />
1 2 3 4 5 6 7 8 9 10 11 12<br />
2006 7.9 -390.3 264.2 -282.3 237.5 468.9 -225.0 225.8 3.6 -138.5 171.8 204.9<br />
2007 32.4 -451.4 379.2 -182.4 81.9 389.8 -340.9 230.4 -67.3 -64.8 7.0 6.8<br />
2008 -74.1 -336.5 97.5 34.3 -127.6 545.0 -60.3 78.5 -30.8 -231.9 -105.8 -136.0<br />
2008 Q1 -9.8 -156.3 91.6 -20.1 18.8 73.2 -68.8 43.2 -22.8 -23.8 -74.6 -85.9<br />
Q2 -25.8 -39.2 -9.4 -85.4 -33.9 151.6 0.7 -14.2 -8.8 -52.8 -117.3 -127.1<br />
Q3 -19.5 -97.0 52.1 22.8 -69.6 170.1 -21.8 2.9 -8.5 -41.6 -10.2 1.9<br />
Q4 -19.0 -44.0 -36.8 117.0 -42.9 150.2 29.7 46.6 9.3 -113.7 96.3 75.0<br />
<strong>2009</strong> Q1 -22.9 -65.6 28.3 7.1 -50.9 139.1 5.7 -41.2 10.0 -82.7 -73.1 -83.8<br />
2008 Apr. -5.9 9.0 -28.0 -22.2 -44.7 52.9 -3.0 -8.4 -3.0 -20.2 -73.5 -73.9<br />
May -21.1 -23.8 18.2 -44.2 -1.2 37.4 0.9 -5.2 -10.6 -18.0 -67.5 -69.6<br />
June 1.2 -24.4 0.4 -19.0 12.0 61.2 2.7 -0.6 4.7 -14.6 23.7 16.4<br />
<strong>July</strong> -2.5 -38.0 22.9 7.1 -8.2 30.2 -1.7 14.1 -0.1 -44.4 -20.6 -11.8<br />
Aug. -10.6 -21.5 11.1 -2.2 -17.0 33.3 4.8 -9.1 -8.4 9.5 -10.1 -7.8<br />
Sep. -6.4 -37.4 18.1 17.9 -44.5 106.6 -25.0 -2.2 0.0 -6.8 20.4 21.6<br />
Oct. -4.4 -6.7 -2.1 80.0 -60.0 91.9 -18.0 43.9 17.7 -93.0 49.4 42.5<br />
Nov. -11.8 -30.5 -20.2 12.4 -0.6 69.5 5.3 15.9 -5.8 -6.1 28.0 11.6<br />
Dec. -2.8 -6.8 -14.5 24.6 17.7 -11.3 42.4 -13.2 -2.6 -14.6 18.9 20.9<br />
<strong>2009</strong> Jan. -19.2 -20.0 10.9 -11.6 -62.8 46.1 -3.8 -27.9 5.8 -32.0 -114.5 -120.7<br />
Feb. -1.1 -19.3 8.5 14.9 -2.9 54.9 10.0 -22.5 3.6 4.5 50.6 44.6<br />
Mar. -2.6 -26.3 8.9 3.8 14.8 38.1 -0.5 9.2 0.6 -55.3 -9.3 -7.7<br />
Apr. -7.2 -48.4 55.3 -6.7 -27.4 29.8 13.6 22.1 6.7 4.4 42.1 32.9<br />
12-month cumulated transactions<br />
<strong>2009</strong> Apr. -88.5 -303.2 117.5 77.0 -180.0 587.8 30.8 24.5 11.7 -266.3 11.3 -27.2<br />
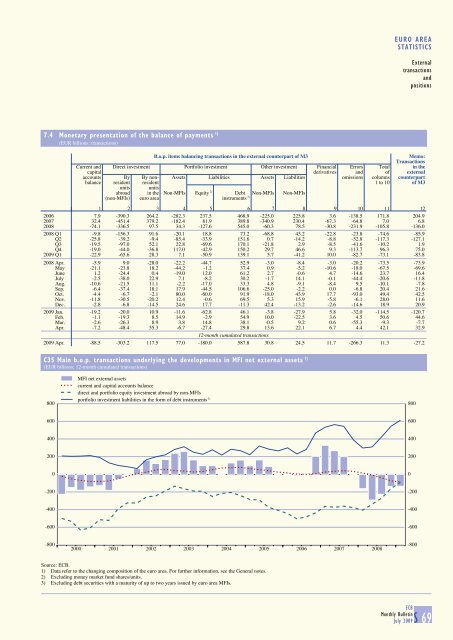
C35 Main b.o.p. transactions un<strong>de</strong>rlying the <strong>de</strong>velopments in MFI net external assets 1)<br />
(EUR billions; 12-month cumulated transactions)<br />
800<br />
MFI net external assets<br />
current and capital accounts balance<br />
direct and portfolio equity investment abroad by non-MFIs<br />
portfolio investment liabilities in the form of <strong>de</strong>bt instruments<br />
3)<br />
800<br />
600<br />
600<br />
400<br />
400<br />
200<br />
200<br />
0<br />
0<br />
-200<br />
-200<br />
-400<br />
-400<br />
-600<br />
-600<br />
-800<br />
2000 2001 2002 2003 2004 2005 2006 2007 2008<br />
-800<br />
Source: ECB.<br />
1) Data refer to the changing composition of the euro area. For further information, see the General notes.<br />
2) Excluding money market fund shares/units.<br />
3) Excluding <strong>de</strong>bt securities with a maturity of up to two years issued by euro area MFIs.<br />
ECB<br />
<strong>Monthly</strong> <strong>Bulletin</strong><br />
<strong>July</strong> <strong>2009</strong>S 69


