

Monthly Bulletin July 2009 - Banque de France
Monthly Bulletin July 2009 - Banque de France
Monthly Bulletin July 2009 - Banque de France

Create successful ePaper yourself
Turn your PDF publications into a flip-book with our unique Google optimized e-Paper software.
Table 3 Securities issued by euro area resi<strong>de</strong>nts<br />
Issuing sector<br />
Amount outstanding<br />
(EUR billions) Annual growth rates 1)<br />
<strong>2009</strong><br />
April<br />
2008<br />
Q2<br />
2008<br />
Q3<br />
2008<br />
Q4<br />
<strong>2009</strong><br />
Q1<br />
<strong>2009</strong><br />
March<br />
<strong>2009</strong><br />
April<br />
Debt securities 13,798 6.9 7.3 7.8 10.7 12.0 12.1<br />
MFIs 5,419 7.8 8.2 5.7 5.9 6.6 6.4<br />
Non-monetary financial corporations 2,033 21.5 23.3 23.8 29.6 31.1 30.6<br />
Non-financial corporations 728 5.9 4.1 5.0 7.7 8.9 9.9<br />
General government 5,617 2.2 2.4 5.6 10.2 12.1 12.5<br />
of which:<br />
Central government 5,267 2.3 2.4 5.8 10.5 12.4 12.6<br />
Other general government 350 1.3 3.0 2.9 5.9 7.9 10.5<br />
Quoted shares 3,435 0.9 0.6 0.8 1.2 1.5 1.7<br />
MFIs 414 1.5 2.8 4.9 7.2 8.0 8.2<br />
Non-monetary financial corporations 249 2.4 2.6 2.6 3.2 3.3 3.4<br />
Non-financial corporations 2,772 0.6 0.0 -0.1 0.0 0.4 0.5<br />
Source: ECB.<br />
1) For <strong>de</strong>tails, see the technical notes for Sections 4.3 and 4.4 of the “Euro area statistics” section.<br />
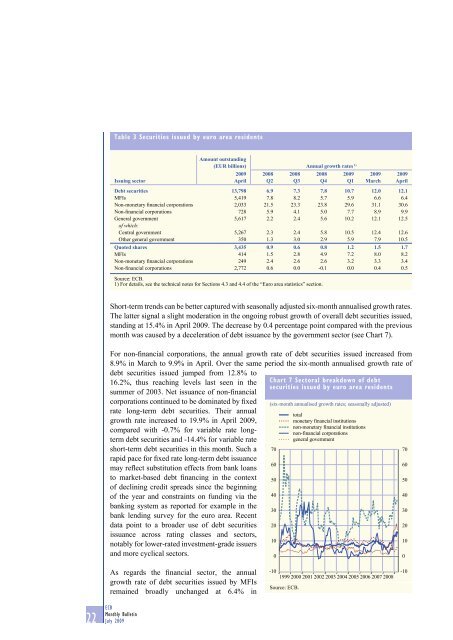
Short-term trends can be better captured with seasonally adjusted six-month annualised growth rates.<br />
The latter signal a slight mo<strong>de</strong>ration in the ongoing robust growth of overall <strong>de</strong>bt securities issued,<br />
standing at 15.4% in April <strong>2009</strong>. The <strong>de</strong>crease by 0.4 percentage point compared with the previous<br />
month was caused by a <strong>de</strong>celeration of <strong>de</strong>bt issuance by the government sector (see Chart 7).<br />
For non-financial corporations, the annual growth rate of <strong>de</strong>bt securities issued increased from<br />
8.9% in March to 9.9% in April. Over the same period the six-month annualised growth rate of<br />
<strong>de</strong>bt securities issued jumped from 12.8% to<br />
16.2%, thus reaching levels last seen in the<br />
summer of 2003. Net issuance of non-financial<br />
corporations continued to be dominated by fixed<br />
rate long-term <strong>de</strong>bt securities. Their annual<br />
growth rate increased to 19.9% in April <strong>2009</strong>,<br />
compared with -0.7% for variable rate longterm<br />
<strong>de</strong>bt securities and -14.4% for variable rate<br />
short-term <strong>de</strong>bt securities in this month. Such a<br />
rapid pace for fixed rate long-term <strong>de</strong>bt issuance<br />
may reflect substitution effects from bank loans<br />
to market-based <strong>de</strong>bt financing in the context<br />
of <strong>de</strong>clining credit spreads since the beginning<br />
of the year and constraints on funding via the<br />
banking system as reported for example in the<br />
bank lending survey for the euro area. Recent<br />
data point to a broa<strong>de</strong>r use of <strong>de</strong>bt securities<br />
issuance across rating classes and sectors,<br />
notably for lower-rated investment-gra<strong>de</strong> issuers<br />
and more cyclical sectors.<br />
Chart 7 Sectoral breakdown of <strong>de</strong>bt<br />
securities issued by euro area resi<strong>de</strong>nts<br />
(six-month annualised growth rates; seasonally adjusted)<br />
70<br />
60<br />
50<br />
40<br />
30<br />
20<br />
10<br />
0<br />
total<br />
monetary financial institutions<br />
non-monetary financial institutions<br />
non-financial corporations<br />
general government<br />
70<br />
60<br />
50<br />
40<br />
30<br />
20<br />
10<br />
0<br />
As regards the financial sector, the annual<br />
growth rate of <strong>de</strong>bt securities issued by MFIs<br />
remained broadly unchanged at 6.4% in<br />
22 ECB<br />
<strong>Monthly</strong> <strong>Bulletin</strong><br />
<strong>July</strong> <strong>2009</strong><br />
-10<br />
1999 2000 2001 2002 2003 2004 2005 2006 2007 2008<br />
Source: ECB.<br />
-10


