

Monthly Bulletin July 2009 - Banque de France
Monthly Bulletin July 2009 - Banque de France
Monthly Bulletin July 2009 - Banque de France

You also want an ePaper? Increase the reach of your titles
YUMPU automatically turns print PDFs into web optimized ePapers that Google loves.
EURO AREA<br />
STATISTICS<br />
Government<br />
finance<br />
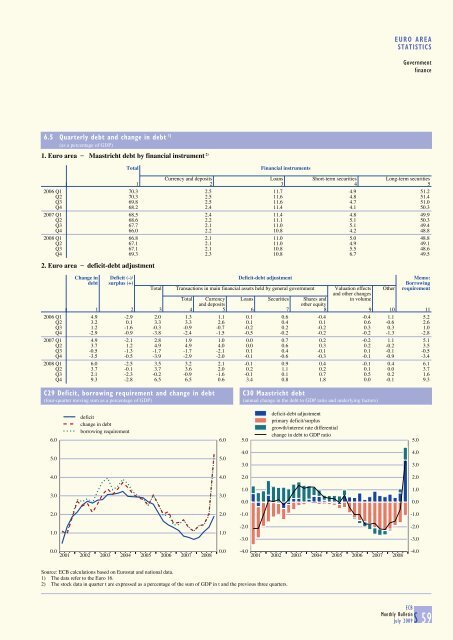
6.5 Quarterly <strong>de</strong>bt and change in <strong>de</strong>bt 1)<br />
(as a percentage of GDP)<br />
1. Euro area _ Maastricht <strong>de</strong>bt by financial instrument 2)<br />
Total Financial instruments<br />
Currency and <strong>de</strong>posits Loans Short-term securities Long-term securities<br />
1 2 3 4 5<br />
2006 Q1 70.3 2.5 11.7 4.9 51.2<br />
Q2 70.3 2.5 11.6 4.8 51.4<br />
Q3 69.8 2.5 11.6 4.7 51.0<br />
Q4 68.2 2.4 11.4 4.1 50.3<br />
2007 Q1 68.5 2.4 11.4 4.8 49.9<br />
Q2 68.6 2.2 11.1 5.1 50.3<br />
Q3 67.7 2.1 11.0 5.1 49.4<br />
Q4 66.0 2.2 10.8 4.2 48.8<br />
2008 Q1 66.8 2.1 11.0 5.0 48.8<br />
Q2 67.1 2.1 11.0 4.9 49.1<br />
Q3 67.1 2.1 10.8 5.5 48.6<br />
Q4 69.3 2.3 10.8 6.7 49.5<br />
2. Euro area _ <strong>de</strong>ficit-<strong>de</strong>bt adjustment<br />
Change in Deficit (-)/ Deficit-<strong>de</strong>bt adjustment Memo:<br />
<strong>de</strong>bt surplus (+) Borrowing<br />
Total Transactions in main financial assets held by general government Valuation effects Other requirement<br />
and other changes<br />
Total Currency Loans Securities Shares and in volume<br />
and <strong>de</strong>posits<br />
other equity<br />
1 2 3 4 5 6 7 8 9 10 11<br />
2006 Q1 4.9 -2.9 2.0 1.3 1.1 0.1 0.6 -0.4 -0.4 1.1 5.2<br />
Q2 3.2 0.1 3.3 3.3 2.6 0.1 0.4 0.1 0.6 -0.6 2.6<br />
Q3 1.2 -1.6 -0.3 -0.9 -0.7 -0.2 0.2 -0.2 0.3 0.3 1.0<br />
Q4 -2.9 -0.9 -3.8 -2.4 -1.5 -0.5 -0.2 -0.2 -0.2 -1.3 -2.8<br />
2007 Q1 4.9 -2.1 2.8 1.9 1.0 0.0 0.7 0.2 -0.2 1.1 5.1<br />
Q2 3.7 1.2 4.9 4.9 4.0 0.0 0.6 0.3 0.2 -0.2 3.5<br />
Q3 -0.5 -1.3 -1.7 -1.7 -2.1 0.1 0.4 -0.1 0.1 -0.1 -0.5<br />
Q4 -3.5 -0.5 -3.9 -2.9 -2.0 -0.1 -0.6 -0.3 -0.1 -0.9 -3.4<br />
2008 Q1 6.0 -2.5 3.5 3.2 2.1 -0.1 0.9 0.4 -0.1 0.4 6.1<br />
Q2 3.7 -0.1 3.7 3.6 2.0 0.2 1.1 0.2 0.1 0.0 3.7<br />
Q3 2.1 -2.3 -0.2 -0.9 -1.6 -0.1 0.1 0.7 0.5 0.2 1.6<br />
Q4 9.3 -2.8 6.5 6.5 0.6 3.4 0.8 1.8 0.0 -0.1 9.3<br />
C29 Deficit, borrowing requirement and change in <strong>de</strong>bt<br />
(four-quarter moving sum as a percentage of GDP)<br />
C30 Maastricht <strong>de</strong>bt<br />
(annual change in the <strong>de</strong>bt to GDP ratio and un<strong>de</strong>rlying factors)<br />
6.0<br />
<strong>de</strong>ficit<br />
change in <strong>de</strong>bt<br />
borrowing requirement<br />
6.0<br />
5.0<br />
<strong>de</strong>ficit-<strong>de</strong>bt adjustment<br />
primary <strong>de</strong>ficit/surplus<br />
growth/interest rate differential<br />
change in <strong>de</strong>bt to GDP ratio<br />
5.0<br />
5.0<br />
5.0<br />
4.0<br />
3.0<br />
4.0<br />
3.0<br />
4.0<br />
4.0<br />
2.0<br />
2.0<br />
3.0<br />
3.0<br />
1.0<br />
0.0<br />
1.0<br />
0.0<br />
2.0<br />
2.0<br />
-1.0<br />
-1.0<br />
1.0<br />
1.0<br />
-2.0<br />
-3.0<br />
-2.0<br />
-3.0<br />
0.0<br />
2001 2002 2003 2004 2005 2006 2007 2008<br />
0.0<br />
-4.0<br />
2001 2002 2003 2004 2005 2006 2007 2008<br />
-4.0<br />
Source: ECB calculations based on Eurostat and national data.<br />
1) The data refer to the Euro 16.<br />
2) The stock data in quarter t are expressed as a percentage of the sum of GDP in t and the previous three quarters.<br />
ECB<br />
<strong>Monthly</strong> <strong>Bulletin</strong><br />
<strong>July</strong> <strong>2009</strong>S 59


