

Monthly Bulletin July 2009 - Banque de France
Monthly Bulletin July 2009 - Banque de France
Monthly Bulletin July 2009 - Banque de France

Create successful ePaper yourself
Turn your PDF publications into a flip-book with our unique Google optimized e-Paper software.
EURO AREA<br />
STATISTICS<br />
Financial<br />
markets<br />
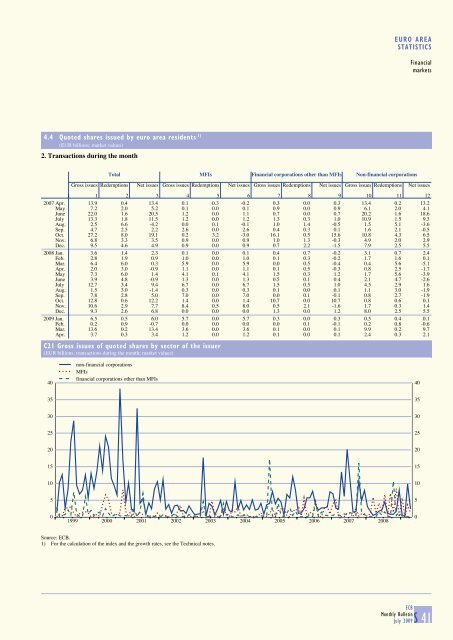
4.4 Quoted shares issued by euro area resi<strong>de</strong>nts 1)<br />
(EUR billions; market values)<br />
2. Transactions during the month<br />
Total MFIs Financial corporations other than MFIs Non-financial corporations<br />
Gross issues Re<strong>de</strong>mptions Net issues Gross issues Re<strong>de</strong>mptions Net issues Gross issues Re<strong>de</strong>mptions Net issues Gross issues Re<strong>de</strong>mptions Net issues<br />
1 2 3 4 5 6 7 8 9 10 11 12<br />
2007 Apr. 13.9 0.4 13.4 0.1 0.3 -0.2 0.3 0.0 0.3 13.4 0.2 13.2<br />
May 7.2 2.0 5.2 0.1 0.0 0.1 0.9 0.0 0.9 6.1 2.0 4.1<br />
June 22.0 1.6 20.5 1.2 0.0 1.1 0.7 0.0 0.7 20.2 1.6 18.6<br />
<strong>July</strong> 13.3 1.8 11.5 1.2 0.0 1.2 1.3 0.3 1.0 10.9 1.5 9.3<br />
Aug. 2.5 6.6 -4.2 0.0 0.1 -0.1 1.0 1.4 -0.5 1.5 5.1 -3.6<br />
Sep. 4.7 2.5 2.2 2.6 0.0 2.6 0.4 0.3 0.1 1.6 2.1 -0.5<br />
Oct. 27.2 8.0 19.1 0.2 3.2 -3.0 16.1 0.5 15.6 10.8 4.3 6.5<br />
Nov. 6.8 3.3 3.5 0.9 0.0 0.9 1.0 1.3 -0.3 4.9 2.0 2.9<br />
Dec. 9.5 4.6 4.9 0.9 0.0 0.9 0.7 2.2 -1.5 7.9 2.5 5.5<br />
2008 Jan. 3.6 1.4 2.3 0.1 0.0 0.1 0.4 0.7 -0.2 3.1 0.7 2.4<br />
Feb. 2.8 1.9 0.9 1.0 0.0 1.0 0.1 0.3 -0.2 1.7 1.6 0.1<br />
Mar. 6.4 6.0 0.3 5.9 0.0 5.9 0.0 0.5 -0.4 0.4 5.6 -5.1<br />
Apr. 2.0 3.0 -0.9 1.1 0.0 1.1 0.1 0.5 -0.3 0.8 2.5 -1.7<br />
May 7.3 6.0 1.4 4.1 0.1 4.1 1.5 0.3 1.2 1.7 5.6 -3.9<br />
June 3.9 4.8 -0.9 1.3 0.0 1.3 0.5 0.1 0.4 2.1 4.7 -2.6<br />
<strong>July</strong> 12.7 3.4 9.4 6.7 0.0 6.7 1.5 0.5 1.0 4.5 2.9 1.6<br />
Aug. 1.5 3.0 -1.4 0.3 0.0 0.3 0.1 0.0 0.1 1.1 3.0 -1.9<br />
Sep. 7.8 2.8 5.0 7.0 0.0 7.0 0.0 0.1 -0.1 0.8 2.7 -1.9<br />
Oct. 12.8 0.6 12.2 1.4 0.0 1.4 10.7 0.0 10.7 0.8 0.6 0.1<br />
Nov. 10.6 2.9 7.7 8.4 0.5 8.0 0.5 2.1 -1.6 1.7 0.3 1.4<br />
Dec. 9.3 2.6 6.8 0.0 0.0 0.0 1.3 0.0 1.2 8.0 2.5 5.5<br />
<strong>2009</strong> Jan. 6.5 0.5 6.0 5.7 0.0 5.7 0.3 0.0 0.3 0.5 0.4 0.1<br />
Feb. 0.2 0.9 -0.7 0.0 0.0 0.0 0.0 0.1 -0.1 0.2 0.8 -0.6<br />
Mar. 13.6 0.2 13.4 3.6 0.0 3.6 0.1 0.0 0.1 9.9 0.2 9.7<br />
Apr. 3.7 0.3 3.4 1.2 0.0 1.2 0.1 0.0 0.1 2.4 0.3 2.1<br />
C21 Gross issues of quoted shares by sector of the issuer<br />
(EUR billions; transactions during the month; market values)<br />
40<br />
non-financial corporations<br />
MFIs<br />
financial corporations other than MFIs<br />
40<br />
35<br />
35<br />
30<br />
30<br />
25<br />
25<br />
20<br />
20<br />
15<br />
15<br />
10<br />
10<br />
5<br />
5<br />
0<br />
1999 2000 2001 2002 2003 2004 2005 2006 2007 2008<br />
0<br />
Source: ECB.<br />
1) For the calculation of the in<strong>de</strong>x and the growth rates, see the Technical notes.<br />
ECB<br />
<strong>Monthly</strong> <strong>Bulletin</strong><br />
<strong>July</strong> <strong>2009</strong>S 41


