

Monthly Bulletin July 2009 - Banque de France
Monthly Bulletin July 2009 - Banque de France
Monthly Bulletin July 2009 - Banque de France

Create successful ePaper yourself
Turn your PDF publications into a flip-book with our unique Google optimized e-Paper software.
9 DEVELOPMENTS<br />
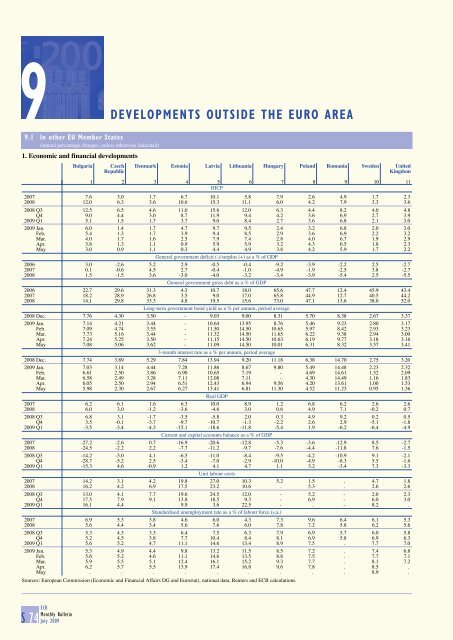
9.1 In other EU Member States<br />
(annual percentage changes, unless otherwise indicated)<br />
1. Economic and financial <strong>de</strong>velopments<br />
OUTSIDE THE EURO AREA<br />
Bulgaria Czech Denmark Estonia Latvia Lithuania Hungary Poland Romania Swe<strong>de</strong>n United<br />
Republic<br />
Kingdom<br />
1 2 3 4 5 6 7 8 9 10 11<br />
HICP<br />
2007 7.6 3.0 1.7 6.7 10.1 5.8 7.9 2.6 4.9 1.7 2.3<br />
2008 12.0 6.3 3.6 10.6 15.3 11.1 6.0 4.2 7.9 3.3 3.6<br />
2008 Q3 12.5 6.5 4.6 11.0 15.6 12.0 6.3 4.4 8.2 4.0 4.8<br />
Q4 9.0 4.4 3.0 8.7 11.9 9.4 4.2 3.6 6.9 2.7 3.9<br />
<strong>2009</strong> Q1 5.1 1.5 1.7 3.7 9.0 8.4 2.7 3.6 6.8 2.1 3.0<br />
<strong>2009</strong> Jan. 6.0 1.4 1.7 4.7 9.7 9.5 2.4 3.2 6.8 2.0 3.0<br />
Feb. 5.4 1.3 1.7 3.9 9.4 8.5 2.9 3.6 6.9 2.2 3.2<br />
Mar. 4.0 1.7 1.6 2.5 7.9 7.4 2.8 4.0 6.7 1.9 2.9<br />
Apr. 3.8 1.3 1.1 0.9 5.9 5.9 3.2 4.3 6.5 1.8 2.3<br />
May 3.0 0.9 1.1 0.3 4.4 4.9 3.8 4.2 5.9 1.7 2.2<br />
General government <strong>de</strong>ficit (-)/surplus (+) as a % of GDP<br />
2006 3.0 -2.6 5.2 2.9 -0.5 -0.4 -9.2 -3.9 -2.2 2.5 -2.7<br />
2007 0.1 -0.6 4.5 2.7 -0.4 -1.0 -4.9 -1.9 -2.5 3.8 -2.7<br />
2008 1.5 -1.5 3.6 -3.0 -4.0 -3.2 -3.4 -3.9 -5.4 2.5 -5.5<br />
General government gross <strong>de</strong>bt as a % of GDP<br />
2006 22.7 29.6 31.3 4.3 10.7 18.0 65.6 47.7 12.4 45.9 43.4<br />
2007 18.2 28.9 26.8 3.5 9.0 17.0 65.8 44.9 12.7 40.5 44.2<br />
2008 14.1 29.8 33.3 4.8 19.5 15.6 73.0 47.1 13.6 38.0 52.0<br />
Long-term government bond yield as a % per annum, period average<br />
2008 Dec. 7.76 4.30 3.50 - 9.03 9.00 8.31 5.70 8.38 2.67 3.37<br />
<strong>2009</strong> Jan. 7.14 4.21 3.44 - 10.64 13.95 8.76 5.46 9.23 2.80 3.17<br />
Feb. 7.09 4.74 3.55 - 11.50 14.50 10.65 5.97 8.42 2.93 3.23<br />
Mar. 7.73 5.16 3.44 - 11.32 14.50 11.65 6.22 9.38 2.94 3.00<br />
Apr. 7.24 5.25 3.50 - 11.15 14.50 10.63 6.19 9.77 3.18 3.16<br />
May 7.08 5.06 3.62 - 11.09 14.50 10.01 6.31 8.32 3.57 3.41<br />
3-month interest rate as a % per annum, period average<br />
2008 Dec. 7.74 3.89 5.29 7.84 13.94 9.20 11.18 6.38 14.70 2.75 3.20<br />
<strong>2009</strong> Jan. 7.03 3.14 4.44 7.28 11.86 8.67 9.80 5.49 14.48 2.23 2.32<br />
Feb. 6.61 2.50 3.86 6.90 10.65 7.19 - 4.69 14.61 1.52 2.09<br />
Mar. 6.58 2.49 3.28 7.11 12.08 7.11 - 4.30 14.49 1.16 1.83<br />
Apr. 6.05 2.50 2.94 6.51 12.43 6.94 9.56 4.20 13.61 1.00 1.53<br />
May 5.98 2.30 2.67 6.27 13.41 6.81 11.30 4.52 11.23 0.95 1.36<br />
Real GDP<br />
2007 6.2 6.1 1.6 6.3 10.0 8.9 1.2 6.8 6.2 2.6 2.6<br />
2008 6.0 3.0 -1.2 -3.6 -4.6 3.0 0.6 4.9 7.1 -0.2 0.7<br />
2008 Q3 6.8 3.1 -1.7 -3.5 -5.8 2.0 0.3 4.9 9.2 0.2 0.5<br />
Q4 3.5 -0.1 -3.7 -9.7 -10.7 -1.3 -2.2 2.6 2.9 -5.1 -1.8<br />
<strong>2009</strong> Q1 -3.5 -3.4 -4.3 -15.1 -18.6 -11.8 -5.4 1.9 -6.2 -6.4 -4.9<br />
Current and capital accounts balance as a % of GDP<br />
2007 -27.2 -2.6 0.7 -16.9 -20.6 -12.8 -5.3 -3.6 -12.9 8.5 -2.7<br />
2008 -24.5 -2.2 2.2 -7.7 -11.2 -9.7 -7.6 -4.4 -11.8 7.6 -1.5<br />
2008 Q3 -14.2 -3.0 4.1 -6.5 -11.0 -8.4 -9.5 -4.2 -10.9 9.1 -2.1<br />
Q4 -28.7 -5.2 2.5 -3.4 -7.0 -2.9 -10.0 -4.9 -8.3 5.5 -1.6<br />
<strong>2009</strong> Q1 -15.3 4.6 -0.9 1.2 4.1 4.7 1.1 3.2 -3.4 7.3 -3.3<br />
Unit labour costs<br />
2007 14.2 3.1 4.2 19.8 27.0 10.3 5.2 1.5 . 4.7 1.8<br />
2008 16.2 4.2 6.9 17.5 23.2 10.6 . 5.3 . 2.6 2.6<br />
2008 Q3 13.0 4.1 7.7 19.6 24.5 12.0 - 5.2 - 2.0 2.3<br />
Q4 17.5 7.9 9.1 13.8 18.5 9.3 - 6.9 - 6.0 3.0<br />
<strong>2009</strong> Q1 16.1 4.4 . 9.9 3.6 22.5 - . - 8.2 .<br />
Standardised unemployment rate as a % of labour force (s.a.)<br />
2007 6.9 5.3 3.8 4.6 6.0 4.3 7.3 9.6 6.4 6.1 5.3<br />
2008 5.6 4.4 3.4 5.6 7.6 6.0 7.8 7.2 5.8 6.2 5.6<br />
2008 Q3 5.3 4.3 3.3 6.4 7.5 6.3 7.9 6.9 5.7 6.0 5.8<br />
Q4 5.2 4.5 3.8 7.7 10.4 8.4 8.1 6.9 5.8 6.9 6.3<br />
<strong>2009</strong> Q1 5.6 5.2 4.7 11.1 14.6 13.4 8.9 7.5 . 7.7 7.0<br />
<strong>2009</strong> Jan. 5.3 4.9 4.4 9.8 13.2 11.5 8.5 7.2 . 7.4 6.8<br />
Feb. 5.6 5.2 4.6 11.1 14.6 13.5 8.8 7.5 . 7.7 7.1<br />
Mar. 5.9 5.5 5.1 12.4 16.1 15.2 9.3 7.7 . 8.1 7.2<br />
Apr. 6.2 5.7 5.5 13.9 17.4 16.8 9.6 7.8 . 8.5 .<br />
May . . . . . . . . . 8.9 .<br />
Sources: European Commission (Economic and Financial Affairs DG and Eurostat), national data, Reuters and ECB calculations.<br />
S 74 ECB<br />
<strong>Monthly</strong> <strong>Bulletin</strong><br />
<strong>July</strong> <strong>2009</strong>


