

Monthly Bulletin July 2009 - Banque de France
Monthly Bulletin July 2009 - Banque de France
Monthly Bulletin July 2009 - Banque de France

Create successful ePaper yourself
Turn your PDF publications into a flip-book with our unique Google optimized e-Paper software.
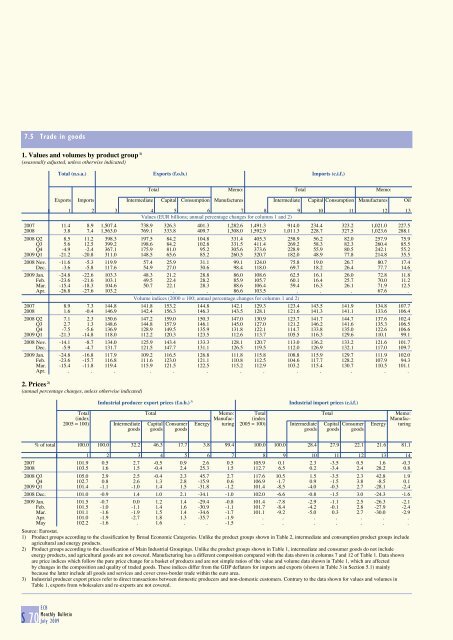
7.5 Tra<strong>de</strong> in goods<br />
1. Values and volumes by product group 1)<br />
(seasonally adjusted, unless otherwise indicated)<br />
Total (n.s.a.) Exports (f.o.b.) Imports (c.i.f.)<br />
Total Memo: Total Memo:<br />
Exports Imports Intermediate Capital Consumption Manufactures Intermediate Capital Consumption Manufactures Oil<br />
1 2 3 4 5 6 7 8 9 10 11 12 13<br />
Values (EUR billions; annual percentage changes for columns 1 and 2)<br />
2007 11.4 8.9 1,507.4 738.9 326.3 401.3 1,282.6 1,491.3 914.0 234.4 323.2 1,021.0 227.5<br />
2008 3.8 7.4 1,563.0 769.1 333.8 409.7 1,308.0 1,592.9 1,011.3 228.7 327.5 1,023.6 288.1<br />
2008 Q2 8.5 11.2 398.3 197.5 84.2 104.8 331.4 405.3 258.9 56.2 82.0 257.9 75.9<br />
Q3 5.6 12.5 399.2 198.6 84.2 102.8 331.5 411.4 269.2 58.3 82.3 260.4 85.5<br />
Q4 -4.9 -2.4 367.1 175.9 81.0 95.2 305.6 373.6 228.9 55.9 80.5 242.1 55.2<br />
<strong>2009</strong> Q1 -21.2 -20.8 311.0 148.5 65.6 85.2 260.5 320.7 182.0 48.9 77.8 214.8 35.5<br />
2008 Nov. -11.6 -5.3 119.9 57.4 25.9 31.1 99.1 124.0 75.8 19.0 26.7 80.7 17.4<br />
Dec. -3.6 -5.8 117.6 54.9 27.0 30.6 98.4 118.0 69.7 18.2 26.4 77.7 14.6<br />
<strong>2009</strong> Jan. -24.8 -22.6 103.3 48.3 21.2 28.8 86.0 108.6 62.5 16.1 26.0 72.8 11.8<br />
Feb. -23.6 -21.6 103.1 49.5 22.4 28.2 85.9 105.7 60.1 16.4 25.7 70.0 11.2<br />
Mar. -15.4 -18.3 104.6 50.7 22.1 28.3 88.6 106.4 59.4 16.3 26.1 71.9 12.5<br />
Apr. -26.8 -27.6 103.2 . . . 86.6 103.5 . . . 67.6 .<br />
Volume indices (2000 = 100; annual percentage changes for columns 1 and 2)<br />
2007 8.9 7.3 144.8 141.8 153.2 144.8 142.1 129.3 123.4 143.5 141.9 134.8 107.7<br />
2008 1.6 -0.4 146.9 142.4 156.3 146.3 143.5 128.1 121.6 141.3 141.1 133.6 106.4<br />
2008 Q2 7.1 2.3 150.6 147.2 159.0 150.3 147.0 130.9 123.7 141.7 144.7 137.6 102.4<br />
Q3 2.7 1.3 148.6 144.8 157.9 146.1 145.0 127.0 121.2 146.2 141.6 135.3 106.5<br />
Q4 -7.5 -5.6 136.9 128.9 149.5 135.9 131.8 122.1 114.7 133.8 135.0 122.6 106.6<br />
<strong>2009</strong> Q1 -21.3 -14.8 118.0 112.2 120.3 123.5 112.6 113.7 105.5 116.3 129.6 110.1 99.1<br />
2008 Nov. -14.1 -8.7 134.0 125.9 143.4 133.3 128.1 120.7 113.0 136.2 133.2 121.6 101.7<br />
Dec. -5.9 -4.7 131.7 121.5 147.7 131.1 126.5 119.5 112.0 126.9 132.1 117.0 109.7<br />
<strong>2009</strong> Jan. -24.8 -16.8 117.9 109.2 116.5 126.8 111.8 115.8 108.8 115.9 129.7 111.9 102.0<br />
Feb. -23.6 -15.7 116.8 111.6 123.0 121.1 110.8 112.5 104.6 117.7 128.2 107.9 94.3<br />
Mar. -15.4 -11.8 119.4 115.9 121.5 122.5 115.2 112.9 103.2 115.4 130.7 110.5 101.1<br />
Apr. . . . . . . . . . . . . .<br />
2. Prices 2)<br />
(annual percentage changes, unless otherwise indicated)<br />
Industrial producer export prices (f.o.b.) 3)<br />
Industrial import prices (c.i.f.)<br />
Total Total Memo: Total Total Memo:<br />
(in<strong>de</strong>x Manufac- (in<strong>de</strong>x Manufac-<br />
2005 = 100) Intermediate Capital Consumer Energy turing 2005 = 100) Intermediate Capital Consumer Energy turing<br />
goods goods goods goods goods goods<br />
% of total 100.0 100.0 32.2 46.3 17.7 3.8 99.4 100.0 100.0 28.4 27.9 22.1 21.6 81.1<br />
1 2 3 4 5 6 7 8 9 10 11 12 13 14<br />
2007 101.9 0.5 2.7 -0.5 0.9 2.6 0.5 105.9 0.1 2.3 -3.5 0.5 1.6 -0.3<br />
2008 103.5 1.6 1.5 -0.4 2.4 25.3 1.5 112.7 6.5 0.2 -3.4 2.4 28.2 0.8<br />
2008 Q3 105.0 2.9 2.5 -0.4 2.3 45.7 2.7 117.6 10.5 1.5 -3.5 2.3 42.8 1.9<br />
Q4 102.7 0.8 2.6 1.3 2.8 -15.9 0.6 106.9 -1.7 0.9 -1.5 3.8 -8.5 0.1<br />
<strong>2009</strong> Q1 101.4 -1.1 -1.0 1.4 1.5 -31.8 -1.2 101.4 -8.5 -4.0 -0.3 2.7 -28.1 -2.4<br />
2008 Dec. 101.0 -0.9 1.4 1.0 2.1 -34.1 -1.0 102.0 -6.6 -0.8 -1.5 3.0 -24.3 -1.6<br />
<strong>2009</strong> Jan. 101.5 -0.7 0.0 1.2 1.4 -29.4 -0.8 101.4 -7.8 -2.9 -1.1 2.5 -26.3 -2.1<br />
Feb. 101.5 -1.0 -1.1 1.4 1.6 -30.9 -1.1 101.7 -8.4 -4.2 -0.1 2.8 -27.9 -2.4<br />
Mar. 101.1 -1.6 -1.9 1.5 1.4 -34.6 -1.7 101.1 -9.2 -5.0 0.3 2.7 -30.0 -2.9<br />
Apr. 101.0 -1.9 -2.7 1.8 1.3 -35.7 -1.9 . . . . . . .<br />
May 102.2 -1.6 . 1.6 . . -1.5 . . . . . . .<br />
Source: Eurostat.<br />
1) Product groups according to the classification by Broad Economic Categories. Unlike the product groups shown in Table 2, intermediate and consumption product groups inclu<strong>de</strong><br />
agricultural and energy products.<br />
2) Product groups according to the classification of Main Industrial Groupings. Unlike the product groups shown in Table 1, intermediate and consumer goods do not inclu<strong>de</strong><br />
energy products, and agricultural goods are not covered. Manufacturing has a different composition compared with the data shown in columns 7 and 12 of Table 1. Data shown<br />
are price indices which follow the pure price change for a basket of products and are not simple ratios of the value and volume data shown in Table 1, which are affected<br />
by changes in the composition and quality of tra<strong>de</strong>d goods. These indices differ from the GDP <strong>de</strong>flators for imports and exports (shown in Table 3 in Section 5.1) mainly<br />
because the latter inclu<strong>de</strong> all goods and services and cover cross-bor<strong>de</strong>r tra<strong>de</strong> within the euro area.<br />
3) Industrial producer export prices refer to direct transactions between domestic producers and non-domestic customers. Contrary to the data shown for values and volumes in<br />
Table 1, exports from wholesalers and re-exports are not covered.<br />
S 70 ECB<br />
<strong>Monthly</strong> <strong>Bulletin</strong><br />
<strong>July</strong> <strong>2009</strong>


