Education, Training and Networking for Entrepreneurship in ...
Education, Training and Networking for Entrepreneurship in ...
Education, Training and Networking for Entrepreneurship in ...

You also want an ePaper? Increase the reach of your titles
YUMPU automatically turns print PDFs into web optimized ePapers that Google loves.
The response to each question can be coded on<br />
a scale from 1 to 3 <strong>for</strong> <strong>in</strong>creas<strong>in</strong>g <strong>in</strong>novativeness<br />
(the first question is coded 1 <strong>for</strong> ”none”, 2<br />
<strong>for</strong> ”some” <strong>and</strong> 3 <strong>for</strong> ”all”; the second question<br />
is coded 1 <strong>for</strong> ”many”, 2 <strong>for</strong> ”few” <strong>and</strong> 3 <strong>for</strong> ”no<br />
others”; <strong>and</strong> the third question is coded 1 <strong>for</strong><br />
”longer than five years”, 2 <strong>for</strong> ”between one to<br />
five years” <strong>and</strong> 3 <strong>for</strong> ”less than a year”). The<br />
responses to the three questions are correlated<br />
positively, so <strong>in</strong>novativeness on one question<br />
tends to go h<strong>and</strong> <strong>in</strong> h<strong>and</strong> with <strong>in</strong>novativeness<br />
on another question. There<strong>for</strong>e a reasonably<br />
good overall measure of an entrepreneur’s <strong>in</strong>novativeness<br />
is the average of the three responses<br />
given by the entrepreneur. This measure<br />
of <strong>in</strong>novativeness ranges from 1 to 3. Entrepreneurs<br />
with an average of at least 2 shall be<br />
called <strong>in</strong>novative, <strong>and</strong> entrepreneurs with an<br />
average below 2 are called less <strong>in</strong>novative.<br />
Here we first exam<strong>in</strong>e the relationship between<br />
<strong>in</strong>novativeness <strong>and</strong> education, then exam<strong>in</strong>e<br />
the relationship between <strong>in</strong>novativeness <strong>and</strong><br />
tra<strong>in</strong><strong>in</strong>g, then the relationship between <strong>in</strong>novativeness<br />
<strong>and</strong> competency, <strong>and</strong> then the relationship<br />
between <strong>in</strong>novativeness <strong>and</strong> network<strong>in</strong>g.<br />
Such a relationship is first exam<strong>in</strong>ed while ignor<strong>in</strong>g<br />
other conditions that may impact the relationship.<br />
Go<strong>in</strong>g beyond this limitation <strong>in</strong> a<br />
more elaborate analysis, we then exam<strong>in</strong>e how<br />
<strong>in</strong>novativeness is related to all four conditions<br />
simultaneously, <strong>and</strong> estimate the effect of each<br />
condition, while hold<strong>in</strong>g the other conditions<br />
constant.<br />
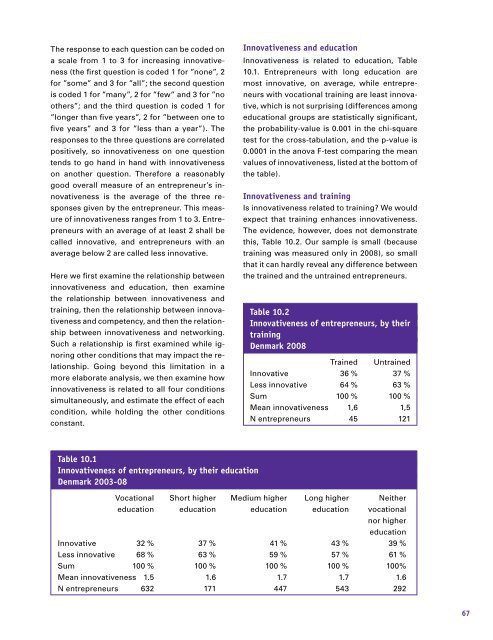
Innovativeness <strong>and</strong> education<br />
Innovativeness is related to education, Table<br />
10.1. Entrepreneurs with long education are<br />
most <strong>in</strong>novative, on average, while entrepreneurs<br />
with vocational tra<strong>in</strong><strong>in</strong>g are least <strong>in</strong>novative,<br />
which is not surpris<strong>in</strong>g (differences among<br />
educational groups are statistically significant,<br />
the probability-value is 0.001 <strong>in</strong> the chi-square<br />
test <strong>for</strong> the cross-tabulation, <strong>and</strong> the p-value is<br />
0.0001 <strong>in</strong> the anova F-test compar<strong>in</strong>g the mean<br />
values of <strong>in</strong>novativeness, listed at the bottom of<br />
the table).<br />
Innovativeness <strong>and</strong> tra<strong>in</strong><strong>in</strong>g<br />
Is <strong>in</strong>novativeness related to tra<strong>in</strong><strong>in</strong>g? We would<br />
expect that tra<strong>in</strong><strong>in</strong>g enhances <strong>in</strong>novativeness.<br />
The evidence, however, does not demonstrate<br />
this, Table 10.2. Our sample is small (because<br />
tra<strong>in</strong><strong>in</strong>g was measured only <strong>in</strong> 2008), so small<br />
that it can hardly reveal any difference between<br />
the tra<strong>in</strong>ed <strong>and</strong> the untra<strong>in</strong>ed entrepreneurs.<br />
Table 10.2<br />
Innovativeness of entrepreneurs, by their<br />
tra<strong>in</strong><strong>in</strong>g<br />
Denmark 2008<br />
Tra<strong>in</strong>ed Untra<strong>in</strong>ed<br />
Innovative 36 % 37 %<br />
Less <strong>in</strong>novative 64 % 63 %<br />
Sum 100 % 100 %<br />
Mean <strong>in</strong>novativeness 1,6 1,5<br />
N entrepreneurs 45 121<br />
Table 10.1<br />
Innovativeness of entrepreneurs, by their education<br />
Denmark 2003-08<br />
Vocational Short higher Medium higher Long higher Neither<br />
education education education education vocational<br />
nor higher<br />
education<br />
Innovative 32 % 37 % 41 % 43 % 39 %<br />
Less <strong>in</strong>novative 68 % 63 % 59 % 57 % 61 %<br />
Sum 100 % 100 % 100 % 100 % 100%<br />
Mean <strong>in</strong>novativeness 1.5 1.6 1.7 1.7 1.6<br />
N entrepreneurs 632 171 447 543 292<br />
67