- Page 2 and 3:
UNIVERSITY OF HONG KOHG LlBEAEY
- Page 5 and 6:
International Conference on East As
- Page 7 and 8:
FOREWORD The International Conferen
- Page 10 and 11:
VHI LIST OF PARTICIPANTS IN THE PHO
- Page 12 and 13:
45 LIM, Hock National University of
- Page 15:
XIII INTERNATIONAL ORGANIZING COMMI
- Page 18 and 19:
XV! The mean heat sources over Asia
- Page 20 and 21:
XVIII , Jhe impact of urbanization
- Page 22 and 23:
XX The East Asia heavy rainfall num
- Page 24 and 25:
THE THERMAL STRUCTURE AND CONVECTIV
- Page 26 and 27:
THE COUPLING OF UPPER-LEVEL AND LOW
- Page 28 and 29:
Q \ ed atmospheric processes * 2. M
- Page 30 and 31:
2) DH Experiment The horizontal flo
- Page 32 and 33:
of the orography, establishing a na
- Page 34:
11 a o 12 21 36 4$ 60 fZ Pig.3. Nea
- Page 37 and 38:
14 OVERVIB/V CF MEI-YU RESEARCH IN
- Page 39 and 40:
16 Fig.l Climatological daily rainf
- Page 41 and 42:
18 showed a marked contrast between
- Page 43 and 44:
20 3. SWDPTiC ^mLYSIS WD DIA^DSTIC
- Page 45 and 46:
22 and Chang (27). It was also foun
- Page 47 and 48:
24 triggering mechanisms. In additi
- Page 49 and 50:
26 important mechanism for creating
- Page 51 and 52:
28 mature convections. Satellite pi
- Page 53 and 54:
30 States included 70 scientists an
- Page 55 and 56:
1-4 M-H C CO *+-« C CD 4-9 C o •
- Page 57 and 58:
34 19.Chen, G.T. J., "A study on sy
- Page 59 and 60:
36 complexes: 27-28 May 1981 case",
- Page 61 and 62:
38 On Temporal Variations of Low Le
- Page 63 and 64:
40 low-level flows of the Asian sum
- Page 65 and 66:
42 the northern part of the Pacific
- Page 67 and 68:
44 cycle is observed for the amplit
- Page 69 and 70:
46 SUMMER (6-85 : 12 2 M979 P:850 M
- Page 71 and 72:
Observed Structure and Propagation
- Page 73 and 74:
50 southeasterly current in the wes
- Page 75 and 76:
40°N 30°N 15°N Equator 90°E 105
- Page 77 and 78:
54 The pattern of arrows in Fig. 3
- Page 79 and 80:
56 Figure 5. Vertical cross-section
- Page 81 and 82:
58 TOE MEAN HEAT SOURCES OVER ASIAN
- Page 83 and 84:
60 over tost parts of India, Southe
- Page 85 and 86:
62 inctly different types. One is t
- Page 87 and 88:
64 60 70 too no 120 00
- Page 89 and 90: Fig.2.The 7-month mean values of (a
- Page 91 and 92: 68 A NUMERICAL SIMULATION OF THE ME
- Page 93 and 94: 70 Synoptic circulation patterns fo
- Page 95 and 96: 72 (iii) The mid-latitude westerlie
- Page 97 and 98: 74 and the temperate latitude weste
- Page 99 and 100: 76 O 1 - (b) Total I Rainf a" 4 0
- Page 101 and 102: 78 LONGITUDE TIME WINOCROS5 SECTION
- Page 103 and 104: A simulation of Lee-Cyclogenesis ov
- Page 105 and 106: 82 implemented to the global model
- Page 107 and 108: 84 In all three experiments, a deep
- Page 109: 86 References: Ballish, A.B., 1980:
- Page 116 and 117: 93 1.2-a I2.S 120. 127,5 US. 11.5 7
- Page 118 and 119: 95 2. Climatology of East Asian mon
- Page 120 and 121: 97 850 MB WIND (U*. V) S. 0 30N i~^
- Page 122 and 123: 99 120 ISO ISO 210 2VJ 770 ISO 180
- Page 124 and 125: Figure 6 (a) Time-longitude section
- Page 126 and 127: 103 Monsoon cyclones /-~N I Subtrop
- Page 128 and 129: 105 INFLUENCE OF VARIATIONS OF THE
- Page 130 and 131: surface during the rainy period of
- Page 132 and 133: located at the position of the firs
- Page 134 and 135: egion of western Australia. These t
- Page 138: 115 Fig.^57 Characteristics of vari
- Page 143 and 144: 120 The model results also demonstr
- Page 145 and 146: 122 The diabatic heating rate Q inc
- Page 147 and 148: 124 MODE SELECTION (WL=200QQ KM) MO
- Page 149 and 150: 126 (a) OEOPOTEHTIflL FRED (A] VEKT
- Page 151 and 152: 128 CQMPRRISON OF GROWTH RflTE KELV
- Page 153 and 154: 130 from the dynamic effect of the
- Page 155 and 156: 132 Altitude: Inclination: Period:
- Page 157 and 158: 134 Local enhanced cloud image Clou
- Page 162 and 163: 139 APPLYING TROPOPAUSE DATA OBSERV
- Page 164 and 165: The main objectives of the Program
- Page 166 and 167: 143 system, method of assimilation
- Page 168 and 169: 145 Some radiosonde data were used
- Page 170 and 171: 147 [13 [2] [3] [43 [5] [6] [73 [8]
- Page 172 and 173: 149 0 1 2 3 4 o T(°K) FLq. 7 The R
- Page 174 and 175: 151 1. INTRODUCTION In this study,
- Page 176 and 177: 153 3. METHODOLOGY The data analysi
- Page 178 and 179: 155 0*73 KM TAMEX IOP2 00*31 a P »
- Page 180 and 181: 157 • cooling to a minimum from t
- Page 182 and 183: 159 6. ACKNOWLEDGMENTS The authors
- Page 184 and 185: 161 seasons sometimes brought great
- Page 186 and 187: 163 carefully analyzed. In Fig.3 th
- Page 188 and 189: 165 Fig. 6. (a) The 850 mb map of 0
- Page 190 and 191:
167 i: Fig.10. The CAA radar reflec
- Page 192 and 193:
169 convergence. Consequently a str
- Page 194 and 195:
171 Atmospheric optical remote sens
- Page 196 and 197:
Lambert reflector, there is no need
- Page 198 and 199:
175 occurs and the average is 0.^1.
- Page 200 and 201:
In order to futher broaden applicat
- Page 202 and 203:
[21]* Lu Daren, "Lidar Equation Tak
- Page 204 and 205:
time to derive the radar estimated
- Page 206 and 207:
time interval of 60 minutes, the av
- Page 208 and 209:
The digital radar at RO has been ve
- Page 210 and 211:
187 FIGURE 1. LOCATION OF RADAR AND
- Page 212 and 213:
iU 9 FIGURE 5. REGRESSION RELATION
- Page 214 and 215:
were mainly focused on predicting f
- Page 216 and 217:
193 following two kinds: (a) Macrob
- Page 218 and 219:
195 Case 1: Squall line Fig. 1 is t
- Page 220 and 221:
197 radar's data makes the weather
- Page 222 and 223:
799 Revival of the Tipping-bucket R
- Page 224 and 225:
201 rainfall, (2) Donnelly ' introd
- Page 226 and 227:
203 at Holt, Missori is just barely
- Page 228 and 229:
205 Table 2 Rainfall Intensity and
- Page 230 and 231:
207 valve micro adjustment valve wa
- Page 232 and 233:
9 10 11 12 - 25 - _ n A . _ _ _ _
- Page 234 and 235:
211 In the final section, the paper
- Page 236 and 237:
213 2.2 Observation From Satellite
- Page 238 and 239:
215 To ascertain the activity of th
- Page 240 and 241:
217 the west-northwest and swept ac
- Page 242 and 243:
was found that instead of slowing d
- Page 244 and 245:
221 1. OBSERVATIONAL ASPECTS Observ
- Page 246 and 247:
223 and i) They receive a substanti
- Page 248 and 249:
225 factor for the rapid collapse o
- Page 250 and 251:
227 clouds. These clouds trap the I
- Page 252 and 253:
229 W/m 2 . It can be seen that the
- Page 254 and 255:
231 Fig. 3. The vertical distributi
- Page 256 and 257:
233 equatorial region, the meridion
- Page 258 and 259:
235 Using a stable leap-frog scheme
- Page 260 and 261:
237 the form d& BS. —£ „ _ n
- Page 262 and 263:
239 Knutson, T. R. , K. M. Weickman
- Page 264 and 265:
241 A Study On The Radiative Balanc
- Page 266 and 267:
243 The net downward solar radiatio
- Page 268 and 269:
245 space. This effect is the green
- Page 270 and 271:
247 are downward. REFERENCES Arakaw
- Page 272 and 273:
249 data from ERBE 31 / 18.4 Fig. 3
- Page 274 and 275:
251 INTRODUCTION TO HEIHE BASIN FEI
- Page 276 and 277:
crop growth, and desert) and climat
- Page 278 and 279:
Rainfall station Well for measuring
- Page 280 and 281:
over desert area and its possible e
- Page 282 and 283:
discontinously in addition to the m
- Page 284 and 285:
261 THE IMPACT OF URBANIZATION ON C
- Page 286 and 287:
263 TABLE 2. Longterm Temperatures
- Page 288 and 289:
265 TABLE 3. Trends in 10 Year Runn
- Page 290 and 291:
267 The change in estimated buildin
- Page 292 and 293:
269 TABLE 4. Commonly Hypothesized
- Page 294 and 295:
271 an effort to minimize the impac
- Page 296 and 297:
273 detailed study of changes in th
- Page 298 and 299:
0: O O o S E S 1 - I • £ o ° £
- Page 300 and 301:
277 2100 GMT 9 MAY 5 104 J03 IO2 10
- Page 302 and 303:
279 It is interesting to note that
- Page 304 and 305:
281 climatology of the MM4 precipit
- Page 306 and 307:
283 Kuo, Y.-H., D.O. Gill and L. Ch
- Page 308 and 309:
285 has been investigated by Eady 6
- Page 310 and 311:
287 with the classical Eady waves,
- Page 312 and 313:
289 Figs. 7-8 (for case 2e) show th
- Page 314 and 315:
291 generate more positive kinetic
- Page 316 and 317:
293 6] Eady, E. T., 1949: Long wave
- Page 318 and 319:
295 But, for wind and geopotential
- Page 320 and 321:
297 dary layer in z-coordinate to a
- Page 322 and 323:
299 As R -*0> 0=1, U T = u , V T ~
- Page 324 and 325:
301 Cb) CO Fig. la shows the orogra
- Page 326 and 327:
2 y -f -5 * b* The numerical result
- Page 328 and 329:
305 expense of smaller droplets and
- Page 330 and 331:
307 low value of 0.4g-irT . The ver
- Page 332 and 333:
309 Parrish, J. ^ L. , and A. J. He
- Page 334 and 335:
31 1987 6/16 165310 T= -1.7 C Z = 5
- Page 336 and 337:
ON DYNAMICAL STUDIES OF ORO GRAPHIC
- Page 338 and 339:
315 lateral boundaries. The model i
- Page 340 and 341:
317 air sounding, over Panchiao (al
- Page 342 and 343:
319 Fig.l Satellite imagery for May
- Page 344 and 345:
321 -ISO -50 X-AXIS C KM Fig,7 The
- Page 346 and 347:
323 Numerical Simulations of topogr
- Page 348 and 349:
325 The physical processes of the o
- Page 350 and 351:
327 Fig. 3 The east-west cross sect
- Page 352 and 353:
329 0500 LST the next morning, the
- Page 354 and 355:
331 (Walker and Rowntree, 1977). Mo
- Page 356 and 357:
Study on the Frontal Cyclone System
- Page 358 and 359:
Fig.9 indicates the ageostrophic co
- Page 360 and 361:
337 £ * ,- (6) dp dy where u g is
- Page 362 and 363:
339 100 110 120 130 Fig.3 The synop
- Page 364 and 365:
•= 1979/2/04/002 VORTICITY KE-S/S
- Page 366 and 367:
343 The Microphysics of a Mei-Yu Ca
- Page 368 and 369:
345 1. Introduction Observational r
- Page 370 and 371:
347 where V(x) = terminal fallspeed
- Page 372 and 373:
349 3.2 Results with Figs. 1 height
- Page 374 and 375:
351 Srivastava, E.G., 1978: Paramet
- Page 376 and 377:
353 TRRCK - 1 (1115 Q - 1131 QJ PR0
- Page 378 and 379:
355 filtered from model because it
- Page 380 and 381:
357 The dispersion relationship is
- Page 382 and 383:
359 REFERENCE Chao Jiping and Ji Zh
- Page 384 and 385:
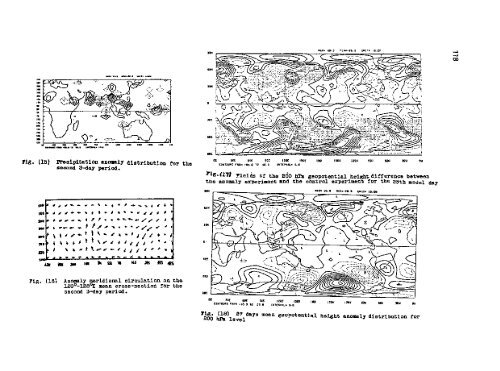
361 Pig. 1. Anomalous fields of the
- Page 386 and 387:
363 Fig. a. Ac the coupling coeffic
- Page 388 and 389:
365 A THREE-DIMENSIONAL MODEL OF TH
- Page 390 and 391:
367 HYDRODYNAMIC MODELING The hydro
- Page 392 and 393:
369 grid, and time level respective
- Page 394 and 395:
Model verification with only astron
- Page 396 and 397:
Rank DESIGN TYPHOON SURGE HEIGHT NE
- Page 398 and 399:
INTERAiWAL VARIABILITIES OF THE WES
- Page 400 and 401:
10° N), the strength index is the
- Page 402 and 403:
warm water of the upper WEPO west o
- Page 404 and 405:
the NWPO and the data obtained from
- Page 406 and 407:
383 UO V E ISO' 160 170' 18CT 0 15U
- Page 408 and 409:
385 Large Scale Air-Sea Interaction
- Page 410 and 411:
387 expands, more and more interact
- Page 412 and 413:
389 On ENSO time scales, the pertur
- Page 414 and 415:
I. The principal processes responsi
- Page 416 and 417:
determine their influence on SST va
- Page 418 and 419:
395 References Hsiung, J., 1985: Es
- Page 420 and 421:
397 Modeling Piiot Studies Enhanced
- Page 422 and 423:
399 THE RELATIONSHIP BETWEEN CURREN
- Page 424 and 425:
401 2. THE PROGRAM The objectives o
- Page 426 and 427:
403 INFLUENCE OF MICROSCALE AIR-SEA
- Page 428 and 429:
405 The results shown In Fig. 1 are
- Page 430 and 431:
407 laboratory, momentum flux to wa
- Page 432 and 433:
some of the problems, which are bac
- Page 434 and 435:
411 REFERENCES Haimbach, S. P. and
- Page 436 and 437:
413 The climatology of global SST f
- Page 438 and 439:
415 Reference Berlage H.P., "The So
- Page 440 and 441:
417 90 N IE' 120' ' 'iio' ' ' ' '12
- Page 442 and 443:
Fig.4. Map of the standard deviatio
- Page 444 and 445:
421 the rugged coastline terrain. A
- Page 446 and 447:
423 The experiment was repeated man
- Page 448 and 449:
425 CONCLUSIONS: The use of wind-tu
- Page 450 and 451:
427 80 60 U mm/s. 40 * 20 0:02 0.04
- Page 452 and 453:
429 THE IMPLEMENTATION AND OPERATIO
- Page 454 and 455:
437 42 Physical Processes The physi
- Page 456 and 457:
433 time cross-section at two grid-
- Page 458 and 459:
435 55 70 75 80 85 90 95 100 105 11
- Page 460 and 461:
437 Nanling Figure 4 Topography (TG
- Page 462 and 463:
439 BMC LIMITED AREA MODEL: OPERATI
- Page 464 and 465:
1 - 00 (P S V -j mV- — JQ.4-6 m w
- Page 466 and 467:
443 and caused severe flood. Local
- Page 468 and 469:
445 forecast. Based on a nested ver
- Page 470 and 471:
447 Fig.5. 24-hour forecasts of RT
- Page 472 and 473:
449 THE OPERATIONAL GLOBAL FORECAST
- Page 474 and 475:
451 Numerical Simulation of Mesosca
- Page 476 and 477:
453 closure model (1974). Radiation
- Page 478 and 479:
455 prone to boundary contamination
- Page 480 and 481:
457 RMS errors for RO is relatively
- Page 482 and 483:
459 Comparison of the surface tempe
- Page 484 and 485:
461 AN OVERVIEW OF PRESENT TYPHOON
- Page 486 and 487:
; 463 and intensity estimation. How
- Page 488 and 489:
465 a. 24-hour forecast errors The
- Page 490 and 491:
467 compared with previous years. S
- Page 492 and 493:
469 Table 1. Initial position error
- Page 494 and 495:
471 Table 5. 48-hour forecast error
- Page 496 and 497:
473 48-hour Forecast Errors Rel. to
- Page 498 and 499:
4/5 tegration scheme basically foll
- Page 500 and 501:
477 '' / » where 1 d . ..... wher
- Page 502 and 503:
ainy season of Yangtze valley (bai-
- Page 504 and 505:
Fig. 1 ECMWF -FGGE analysis of 500
- Page 506 and 507:
483 40} Fig.4 Daily position of the
- Page 508 and 509:
485 THE ROYAL OBSERVATORY LONG RANG
- Page 510 and 511:
487 (2) Based on possible relations
- Page 512 and 513:
489 CONCLUSIONS Seasonal rainfall f
- Page 514 and 515:
491 (verifying against the actual M
- Page 516 and 517:
YEAR 1975 1976 1977 1978 1979 1980
- Page 518 and 519:
495 computational trajectories are
- Page 520 and 521:
497 Substituting Eq. (5) into Eqs.
- Page 522 and 523:
499 These curves divide the plane (
- Page 524 and 525:
501 REFERENCES (1] .Fua,D. ,Chimona
- Page 526 and 527:
503 1. INTRODUCTION The earth topog
- Page 528 and 529:
505 In this study, the following pa
- Page 530 and 531:
507 equations. The 18 ordinary diff
- Page 532 and 533:
509 To investigate the statistical
- Page 534 and 535:
511 0 ^^S08%#g!%J!J#^ a), T, Q 3 Ap
- Page 536 and 537:
FREQUENCY DISTRIBUTION OF 30 DAY RU
- Page 538 and 539:
515 EFFECTS OF VERTICAL WIND-SHEAR
- Page 540 and 541:
517 ANALOGOUS RHYTHM PHENOMENON OF
- Page 542 and 543:
519 layers of the earth's crust) sh
- Page 544 and 545:
521 where r 4j is the correlation c
- Page 546 and 547:
the equations and so on. Then perfo
- Page 548 and 549:
525 An Inquiry into the Nature of R
- Page 550 and 551:
527 (1) - 2F 0 ( + %,0) + JCF.9)) +
- Page 552 and 553:
529 4.a Dependence of the instabiii
- Page 554 and 555:
531 4.b Properties of the unstable
- Page 556 and 557:
the jet core. The maximum value is
- Page 558 and 559:
535 Frederiksen. J., and R. C. Bell
- Page 560 and 561:
537 DYNAMICS OF VORTEX MOTION ON TR
- Page 562 and 563:
In Fiorino and Elsberry (1989), the
- Page 564 and 565:
541 vortex. Solutions obtained by p
- Page 566 and 567:
543 the present linear model, the s
- Page 568 and 569:
545 Figure 3, Steady-state asymmetr
- Page 570 and 571:
547 EFFECT OF THERMAL AND DYNAMIC F
- Page 572 and 573:
549 where b=g(T-Tr)/Tr buoyance for
- Page 574 and 575:
from the center of cyclone. Tn addi
- Page 576 and 577:
553 typhoon, indi rating the primar
- Page 578 and 579:
555 the center at 200 hPa and the m
- Page 580 and 581:
557 vertical turbulent flux of mome
- Page 582 and 583:
559 RECENT RESULTS IN LIMITED-AREA
- Page 584 and 585:
561 PEL scheme consists of a simila
- Page 586 and 587:
563 divergence, vorticity and gener
- Page 588 and 589:
565 Fig. 1. Observations and 24 hou
- Page 590:
567 62. S 56.5 -70.0 -60.0 58.5 or
- Page 593 and 594:
LIN,Y.J. Structural features of a s
- Page 595:
572 WANG, Bin WANG, Jough-Tai WU, J