
Create successful ePaper yourself
Turn your PDF publications into a flip-book with our unique Google optimized e-Paper software.
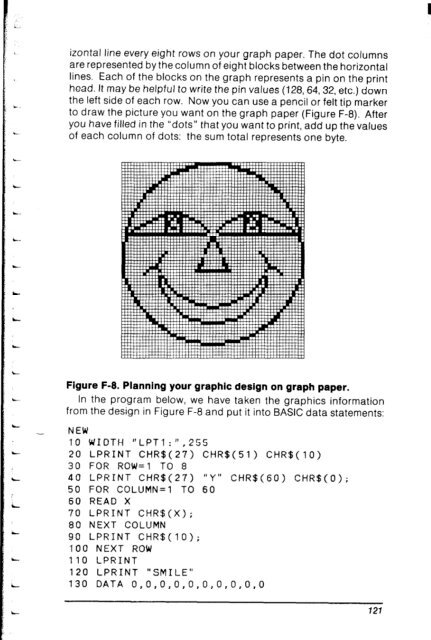
izontal tine every eight rows on your graph paper. The dot columns<br />
are represented by the column of eight blocks between the horizontal<br />
lines. Each of the blocks on the graph represents a pin on the print<br />
head. It may be helpful to write the pin values (128,64,32, etc.) down<br />
the left side of each row. Now you can use a pencil or felt tip marker<br />
to draw the picture you want on the graph paper (Figure F-8). After<br />
you have filled in the “dots” that you want to print, add up the values<br />
of each column of dots: the sum total represents one byte.<br />
Figure F-8. Planning your graphic design on graph paper.<br />
In the program below, we have taken the graphics information<br />
from the design in Figure F-8 and put it into BASIC data statements:<br />
NEW<br />
<strong>10</strong> WIDTH “LPT1:“,255<br />
20 LPRINT CHR$(27) CHR$(Sl) CHR$(lO)<br />
30 FOR ROW=1 TO 8<br />
40 LPRINT CHR$(27) “Y“ CHR$(GO) CHR$(O);<br />
50 FOR COLUMN=1 TO 60<br />
60 READ X<br />
70 LPRINT CHR$(X);<br />
80 NEXT COLUMN<br />
90 LPRINT CHR$(lO);<br />
<strong>10</strong>0 NEXT ROW<br />
1<strong>10</strong> LPRINT<br />
120 LPRINT “SMILE”<br />
130 DATA O,O,O,O,O,O,O.O,O,O<br />
727