State of World Population 2012 - Country Page List - UNFPA
State of World Population 2012 - Country Page List - UNFPA
State of World Population 2012 - Country Page List - UNFPA

You also want an ePaper? Increase the reach of your titles
YUMPU automatically turns print PDFs into web optimized ePapers that Google loves.
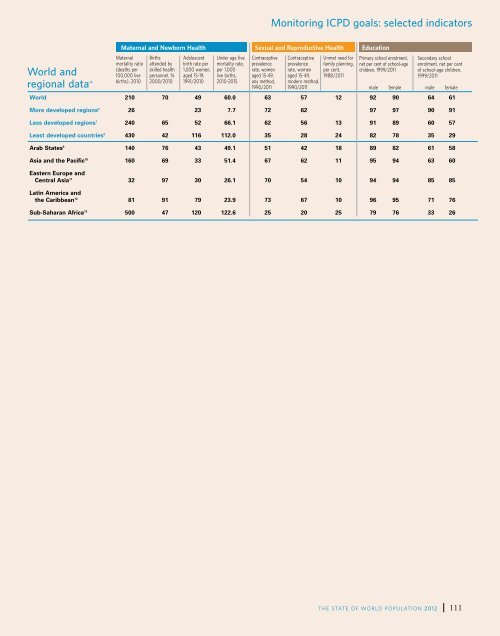
Monitoring Monitoring ICPD ICPD Goals goals: – Selected selected Indicators indicators<br />
Indicators <strong>of</strong> Mortality Indicators <strong>of</strong> Education Reproductive Health Indicators<br />
Infant Maternal Life and expectancy Newborn Health Maternal Primary enrolment Sexual Proportion and Reproductive Secondary Health% Illiterate Education Births per Contraceptive HIV<br />
mortality M/F<br />
mortality (gross) M/F reaching grade 5 enrolment (>15 years) 1,000 Prevalence<br />
prevalence<br />
Maternal Births<br />
Adolescent Under age five Contraceptive Contraceptive Unmet need for Primary school enrolment, Secondary school<br />
Total per<br />
ratio<br />
M/F<br />
(gross) M/F M/F<br />
women<br />
rate (%)<br />
mortality ratio attended by birth rate per mortality rate, prevalence prevalence family planning, net per cent <strong>of</strong> school-age<br />
1,000 live<br />
aged<br />
Any enrolment, Modern net per cent<br />
(15-49)<br />
(deaths per skilled health 1,000 women, per 1,000 rate, women rate, women per cent, children, 1999/2011<br />
births<br />
15-19<br />
method<strong>of</strong> school-age methods children,<br />
M/F<br />
100,000 live personnel, % aged 15-19, live births, aged 15-49, aged 15-49, 1988/2011<br />
1999/2011<br />
births), 2010 2000/2010 1991/2010 2010-2015 any method, modern method,<br />
1990/2011 1990/2011<br />
male female<br />
<strong>World</strong> 210 70 49 60.0 63 57 12 92 90 64 61<br />
<strong>World</strong> and<br />
regional data 14 male female<br />
More developed regions 6 26 23 7.7 72 62 97 97 90 91<br />
Less developed regions 7 240 65 52 66.1 62 56 13 91 89 60 57<br />
Least developed countries 8 430 42 116 112.0 35 28 24 82 78 35 29<br />
Arab <strong>State</strong>s 9 140 76 43 49.1 51 42 18 89 82 61 58<br />
Asia and the Pacific 10 160 69 33 51.4 67 62 11 95 94 63 60<br />
Eastern Europe and<br />
Central Asia 11 32 97 30 26.1 70 54 10 94 94 85 85<br />
Latin America and<br />
the Caribbean 12 81 91 79 23.9 73 67 10 96 95 71 76<br />
Sub-Saharan Africa 13 500 47 120 122.6 25 20 25 79 76 33 26<br />
THE STATE OF WORLD POPULATION <strong>2012</strong><br />
111