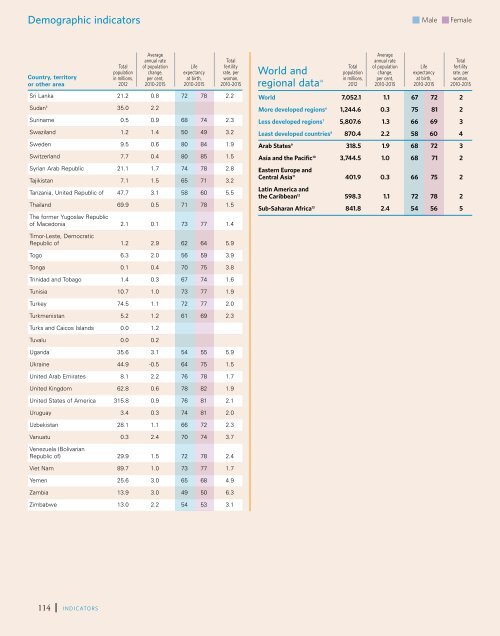
Monitoring Demographic ICPD indicators Goals – Selected Indicators Male Female <strong>Country</strong>, territory or other area Total population in millions, <strong>2012</strong> Average annual rate <strong>of</strong> population change, per cent, 2010-2015 Life expectancy at birth, 2010-2015 Total fertility rate, per woman, 2010-2015 Sri Lanka 21.2 0.8 72 78 2.2 Sudan 5 35.0 2.2 Suriname 0.5 0.9 68 74 2.3 Swaziland 1.2 1.4 50 49 3.2 Sweden 9.5 0.6 80 84 1.9 Switzerland 7.7 0.4 80 85 1.5 Syrian Arab Republic 21.1 1.7 74 78 2.8 Tajikistan 7.1 1.5 65 71 3.2 Tanzania, United Republic <strong>of</strong> 47.7 3.1 58 60 5.5 Thailand 69.9 0.5 71 78 1.5 The former Yugoslav Republic <strong>of</strong> Macedonia 2.1 0.1 73 77 1.4 <strong>World</strong> and regional data 14 Total population in millions, <strong>2012</strong> Average annual rate <strong>of</strong> population change, per cent, 2010-2015 Life expectancy at birth, 2010-2015 Total fertility rate, per woman, 2010-2015 <strong>World</strong> 7,052.1 1.1 67 72 2 More developed regions 6 1,244.6 0.3 75 81 2 Less developed regions 7 5,807.6 1.3 66 69 3 Least developed countries 8 870.4 2.2 58 60 4 Arab <strong>State</strong>s 9 318.5 1.9 68 72 3 Asia and the Pacific 10 3,744.5 1.0 68 71 2 Eastern Europe and Central Asia 11 401.9 0.3 66 75 2 Latin America and the Caribbean 12 598.3 1.1 72 78 2 Sub-Saharan Africa 13 841.8 2.4 54 56 5 Timor-Leste, Democratic Republic <strong>of</strong> 1.2 2.9 62 64 5.9 Togo 6.3 2.0 56 59 3.9 Tonga 0.1 0.4 70 75 3.8 Trinidad and Tobago 1.4 0.3 67 74 1.6 Tunisia 10.7 1.0 73 77 1.9 Turkey 74.5 1.1 72 77 2.0 Turkmenistan 5.2 1.2 61 69 2.3 Turks and Caicos Islands 0.0 1.2 Tuvalu 0.0 0.2 Uganda 35.6 3.1 54 55 5.9 Ukraine 44.9 -0.5 64 75 1.5 United Arab Emirates 8.1 2.2 76 78 1.7 United Kingdom 62.8 0.6 78 82 1.9 United <strong>State</strong>s <strong>of</strong> America 315.8 0.9 76 81 2.1 Uruguay 3.4 0.3 74 81 2.0 Uzbekistan 28.1 1.1 66 72 2.3 Vanuatu 0.3 2.4 70 74 3.7 Venezuela (Bolivarian Republic <strong>of</strong>) 29.9 1.5 72 78 2.4 Viet Nam 89.7 1.0 73 77 1.7 Yemen 25.6 3.0 65 68 4.9 Zambia 13.9 3.0 49 50 6.3 Zimbabwe 13.0 2.2 54 53 3.1 114 INDICATORS
Monitoring ICPD Goals – Selected Indicators Notes for indicators * Most recent data available used for each country in the period specified. 1 Including Christmas Island, Cocos (Keeling) Islands and Norfolk Island. 2 Formerly Zaire. 3 Including Agalesa, Rodrigues and St. Brandon. 4 Due to the formation in July 2011 <strong>of</strong> the Republic <strong>of</strong> South Sudan and its subsequent admission to the United Nations on 14 July 2011, disaggregated data for Sudan and South Sudan as separate <strong>State</strong>s are not yet available for most indicators. Aggregated data presented are for Sudan prior to the independence <strong>of</strong> South Sudan. 5 Does not include South Sudan 6 More-developed regions comprise North America, Japan, Europe and Australia-New Zealand. 7 Less-developed regions comprise all regions <strong>of</strong> Africa, Latin America and Caribbean, Asia (excluding Japan), and Melanesia, Micronesia and Polynesia. 8 Least-developed countries according to standard United Nations designation. 9 Comprising Algeria, Bahrain, Djibouti, Egypt, Iraq, Jordan, Kuwait, Lebanon, Libyan Arab Jamahiriya, Morocco, Occupied Palestinian Territory, Oman, Qatar, Saudi Arabia, Somalia, Sudan, Syrian Arab Republic, Tunisia, United Arab Emirates and Yemen. 10 Includes only <strong>UNFPA</strong> programme countries, territories or other areas: Afghanistan, Bangladesh, Bhutan, Cambodia, China, Cook Islands, Democratic People's Republic <strong>of</strong> Korea, Fiji, India, Indonesia, Iran (Islamic Republic <strong>of</strong>), Kiribati, Lao People's Democratic Republic, Malaysia, Maldives, Marshall Islands, Micronesia, Mongolia, Myanmar, Nauru, Nepal, Niue, Pakistan, Palau, Papua New Guinea, Philippines, Samoa, Solomon Islands, Sri Lanka, Thailand, Timor-Leste, Tokelau, Tonga, Tuvalu, Vanuatu, Viet Nam. 11 Includes only <strong>UNFPA</strong> programme countries, territories or other areas: Albania, Armenia, Azerbaijan, Belarus, Bosnia and Herzegovina, Bulgaria, Georgia, Kazakhstan, Kyrgyzstan, Republic <strong>of</strong> Moldova, Romania, Russian Federation, Serbia, Tajikistan, the former Yugoslav Republic <strong>of</strong> Macedonia, Turkmenistan, Ukraine, Uzbekistan. 12 Includes only <strong>UNFPA</strong> programme countries, territories or other areas: Anguilla, Antigua and Barbuda, Argentina, Bahamas, Barbados, Belize, Bermuda, Bolivia (Plurinational <strong>State</strong> <strong>of</strong>), Brazil, British Virgin Islands, Cayman Islands, Chile, Colombia, Costa Rica, Cuba, Dominica, Dominican Republic, Ecuador, El Salvador, Grenada, Guatemala, Guyana, Haiti, Honduras, Jamaica, Mexico, Montserrat, Netherlands Antilles, Nicaragua, Panama, Paraguay, Peru, Saint Kitts and Nevis, Saint Lucia, St. Vincent and the Grenadines, Suriname, Trinidad and Tobago, Turks and Caicos, Uruguay, Venezuela (Bolivarian Republic <strong>of</strong>). 13 Includes only <strong>UNFPA</strong> programme countries, territories or other areas: Angola, Benin, Botswana, Burkina Faso, Burundi, Cameroon, Cape Verde, Central African Republic, Chad, Comoros, Congo, Côte d'Ivoire, Democratic Republic <strong>of</strong> the Congo, Equatorial Guinea, Eritrea, Ethiopia, Gabon, Gambia, Ghana, Guinea, Guinea-Bissau, Kenya, Lesotho, Liberia, Madagascar, Malawi, Mali, Mauritania, Mauritius, Mozambique, Namibia, Niger, Nigeria, Rwanda, Senegal, Seychelles, Sierra Leone, South Africa, South Sudan, Swaziland, Togo, Uganda, United Republic <strong>of</strong> Tanzania, Zambia, Zimbabwe. 14 Regional aggregations are weighted averages based on countries with available data. Technical notes: Data sources and definitions The statistical tables in The <strong>State</strong> <strong>of</strong> <strong>World</strong> <strong>Population</strong> <strong>2012</strong> include indicators that track progress toward the goals <strong>of</strong> the Programme <strong>of</strong> Action <strong>of</strong> the International Conference on <strong>Population</strong> and Development (ICPD) and the Millennium Development Goals (MDGs) in the areas <strong>of</strong> maternal health, access to education, reproductive and sexual health. In addition, these tables include a variety <strong>of</strong> demographic indicators. Different national authorities and international organizations may employ different methodologies in gathering, extrapolating or analyzing data. To facilitate the international comparability <strong>of</strong> data, <strong>UNFPA</strong> relies on the standard methodologies employed by the main sources <strong>of</strong> data, especially the <strong>Population</strong> Division <strong>of</strong> the United Nations Department <strong>of</strong> Economic and Social Affairs. In some instances, therefore, the data in these tables differ from those generated by national authorities. Regional averages are based on data about countries and territories where <strong>UNFPA</strong> works, rather than on strict geographical definitions employed by the <strong>Population</strong> Division <strong>of</strong> the United Nations Department <strong>of</strong> Economic and Social Affairs. For a list <strong>of</strong> countries included in each regional category in this report, see the “Notes for indicators.” Monitoring ICPD Goals Maternal and Newborn Health Maternal mortality ratio, per 100,000 live births. Source: <strong>World</strong> Health Organization (WHO), UNICEF, <strong>UNFPA</strong> and <strong>World</strong> Bank. 2010. Trends in maternal mortality: 1990 to 2010: WHO. This indicator presents the number <strong>of</strong> deaths to women per 100,000 live births which result from conditions related to pregnancy, delivery, the postpartum period, and related complications. Estimates between 100-999 are rounded to the nearest 10, and above 1,000 to the nearest 100. Several <strong>of</strong> the estimates differ from <strong>of</strong>ficial government figures. The estimates are based on reported figures wherever possible, using approaches that improve the comparability <strong>of</strong> information from different sources. See the source for details on the origin <strong>of</strong> particular national estimates. Estimates and methodologies are reviewed regularly by WHO, UNICEF, <strong>UNFPA</strong>, academic institutions and other agencies and are revised where necessary, as part <strong>of</strong> the ongoing process <strong>of</strong> improving maternal mortality data. Because <strong>of</strong> changes in methods, prior estimates for 1995 and 2000 may not be strictly comparable with these estimates. Maternal mortality estimates reported here are based on the global database on maternal mortality, which is updated periodically. Births attended by skilled health personnel, per cent, 2000/2010 Source: WHO global database on maternal health indicators, <strong>2012</strong> update. Geneva, <strong>World</strong> Health Organization (http://www.who.int/gho). Percentage <strong>of</strong> births attended by skilled health personnel (doctors, nurses or midwives) is the percentage <strong>of</strong> deliveries attended by health personnel trained in providing life-saving obstetric care, including giving the necessary supervision, care and advice to women during pregnancy, labour and the post-partum period; conducting deliveries on their own; and caring for newborns. Traditional birth attendants, even if they receive a short training course, are not included. Adolescent birth rate, per 1,000 women aged 15-19, 1991/2010 Source: United Nations, Department <strong>of</strong> Economic and Social Affairs, <strong>Population</strong> Division (<strong>2012</strong>). <strong>2012</strong> Update for the MDG Database: Adolescent Birth Rate (POP/DB/Fert/A/MDG<strong>2012</strong>). The adolescent THE STATE OF WORLD POPULATION <strong>2012</strong> 115
- Page 1 and 2:
14 November 2012 BY CHOICE, NOT BY
- Page 3 and 4:
state of world population 2012 BY C
- Page 5 and 6:
ut many others have to do with econ
- Page 7 and 8:
t Women who are able to plan their
- Page 9 and 10:
What are the social and economic be
- Page 11 and 12:
CHAPTER ONE The right to family pla
- Page 13 and 14:
to—the social, political and econ
- Page 15 and 16:
1994 At the International Conferenc
- Page 17 and 18:
Rights, 2012). The charges had been
- Page 19 and 20:
health care, which includes family
- Page 21 and 22:
designing and delivering accessible
- Page 23 and 24:
use, and reduces unintended pregnan
- Page 25 and 26:
For UNFPA, the key benefits to impl
- Page 27 and 28:
CHAPTER TWO Analysing data and tren
- Page 29 and 30:
through the wealthiest 20 per cent.
- Page 31 and 32:
pers, advertisements and by word of
- Page 33 and 34:
cohabitating partner (UNICEF, Offic
- Page 35 and 36:
methods are several times more effe
- Page 37 and 38:
Despite the tendency to consolidate
- Page 39 and 40:
CASE STUDY No-scalpel vasectomy in
- Page 41 and 42:
contribute to high unmet need (Sing
- Page 43 and 44:
abortions in the region lead to mor
- Page 45 and 46:
(as stated in the Convention on the
- Page 47 and 48:
arriers prevent individuals from ac
- Page 49 and 50:
CHAPTER THREE Challenges in extendi
- Page 51 and 52:
sources of sexual and reproductive
- Page 53 and 54:
messages were delivered via a numbe
- Page 55 and 56:
Ricardo, 2005). Moreover, young and
- Page 57 and 58:
information and services, including
- Page 59 and 60:
instances of early sexual initiatio
- Page 61 and 62:
ut conventional family planning mes
- Page 63 and 64:
Social Affairs, 2009). Data from 15
- Page 65 and 66:
Many institutions, providers, and c
- Page 67 and 68:
groups (Maya, Xinka, and Garifuna)
- Page 69 and 70:
who are living with HIV and are con
- Page 71 and 72:
Studies suggest that HIV may have a
- Page 73 and 74: with a public health challenge (Wor
- Page 75 and 76: State-run family planning programme
- Page 77 and 78: people in mobile, temporary, and re
- Page 79 and 80: systems and civic participation to
- Page 81 and 82: CHAPTER FOUR The social and economi
- Page 83 and 84: t Community education in Caracas, V
- Page 85 and 86: Estimates of Total Fertility 2010-2
- Page 87 and 88: children, and healthier women also
- Page 89 and 90: empirical evidence supporting this
- Page 91 and 92: y the 1990s was accompanied by incr
- Page 93 and 94: gender equality is much stronger an
- Page 95 and 96: substantially, created new opportun
- Page 97 and 98: CHAPTER FIVE The costs and savings
- Page 99 and 100: Europe; the highest is 64 per cent
- Page 101 and 102: Extending access to meet the unmet
- Page 103 and 104: “family planning” services ofte
- Page 105 and 106: therapy as an inexpensive preventiv
- Page 107 and 108: CHAPTER SIX Making the right to fam
- Page 109 and 110: 1 Expand the reach of family planni
- Page 111 and 112: ange of rights. Meeting those oblig
- Page 113 and 114: including indigenous and ethnic min
- Page 115 and 116: 4 Increase funding for family plann
- Page 117 and 118: Monitoring Monitoring ICPD ICPD Goa
- Page 119 and 120: Monitoring Monitoring ICPD ICPD Goa
- Page 121 and 122: Monitoring Monitoring ICPD ICPD Goa
- Page 123: Monitoring ICPD Goals Demographic -
- Page 127 and 128: Bibliography Abbasi-Shavazi, Mohamm
- Page 129 and 130: Monitoring ICPD Goals - Selected In
- Page 131 and 132: Monitoring ICPD Goals - Selected In
- Page 133 and 134: Monitoring ICPD Goals - Selected In
- Page 135 and 136: Monitoring ICPD Goals - Selected In
- Page 137 and 138: Monitoring ICPD Goals - Selected In
- Page 140: Delivering a world where every preg