State of World Population 2012 - Country Page List - UNFPA
State of World Population 2012 - Country Page List - UNFPA
State of World Population 2012 - Country Page List - UNFPA

You also want an ePaper? Increase the reach of your titles
YUMPU automatically turns print PDFs into web optimized ePapers that Google loves.
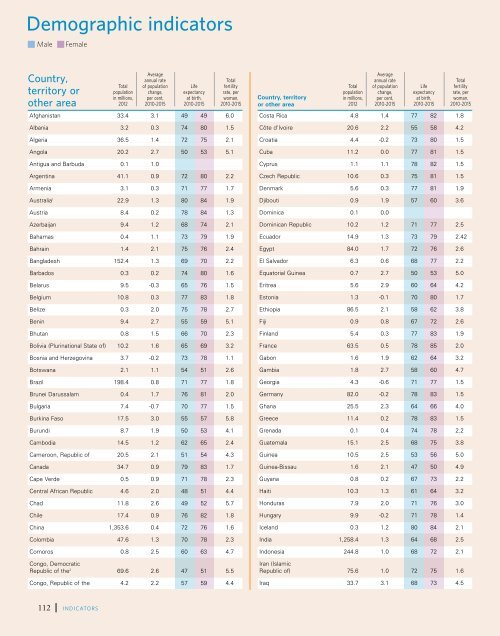
Monitoring ICPD Goals – Selected Indicators<br />
Demographic indicators<br />
Male<br />
Female<br />
<strong>Country</strong>,<br />
territory or<br />
other area<br />
Total<br />
population<br />
in millions,<br />
<strong>2012</strong><br />
Average<br />
annual rate<br />
<strong>of</strong> population<br />
change,<br />
per cent,<br />
2010-2015<br />
Life<br />
expectancy<br />
at birth,<br />
2010-2015<br />
Total<br />
fertility<br />
rate, per<br />
woman,<br />
2010-2015<br />
Afghanistan 33.4 3.1 49 49 6.0<br />
Albania 3.2 0.3 74 80 1.5<br />
Algeria 36.5 1.4 72 75 2.1<br />
Angola 20.2 2.7 50 53 5.1<br />
Antigua and Barbuda 0.1 1.0<br />
Argentina 41.1 0.9 72 80 2.2<br />
Armenia 3.1 0.3 71 77 1.7<br />
Australia 1 22.9 1.3 80 84 1.9<br />
Austria 8.4 0.2 78 84 1.3<br />
Azerbaijan 9.4 1.2 68 74 2.1<br />
Bahamas 0.4 1.1 73 79 1.9<br />
Bahrain 1.4 2.1 75 76 2.4<br />
Bangladesh 152.4 1.3 69 70 2.2<br />
Barbados 0.3 0.2 74 80 1.6<br />
Belarus 9.5 -0.3 65 76 1.5<br />
Belgium 10.8 0.3 77 83 1.8<br />
Belize 0.3 2.0 75 78 2.7<br />
Benin 9.4 2.7 55 59 5.1<br />
Bhutan 0.8 1.5 66 70 2.3<br />
Bolivia (Plurinational <strong>State</strong> <strong>of</strong>) 10.2 1.6 65 69 3.2<br />
Bosnia and Herzegovina 3.7 -0.2 73 78 1.1<br />
Botswana 2.1 1.1 54 51 2.6<br />
Brazil 198.4 0.8 71 77 1.8<br />
Brunei Darussalam 0.4 1.7 76 81 2.0<br />
Bulgaria 7.4 -0.7 70 77 1.5<br />
Burkina Faso 17.5 3.0 55 57 5.8<br />
Burundi 8.7 1.9 50 53 4.1<br />
Cambodia 14.5 1.2 62 65 2.4<br />
Cameroon, Republic <strong>of</strong> 20.5 2.1 51 54 4.3<br />
Canada 34.7 0.9 79 83 1.7<br />
Cape Verde 0.5 0.9 71 78 2.3<br />
Central African Republic 4.6 2.0 48 51 4.4<br />
Chad 11.8 2.6 49 52 5.7<br />
Chile 17.4 0.9 76 82 1.8<br />
China 1,353.6 0.4 72 76 1.6<br />
Colombia 47.6 1.3 70 78 2.3<br />
Comoros 0.8 2.5 60 63 4.7<br />
Congo, Democratic<br />
Republic <strong>of</strong> the 2 69.6 2.6 47 51 5.5<br />
Congo, Republic <strong>of</strong> the 4.2 2.2 57 59 4.4<br />
<strong>Country</strong>, territory<br />
or other area<br />
Total<br />
population<br />
in millions,<br />
<strong>2012</strong><br />
Average<br />
annual rate<br />
<strong>of</strong> population<br />
change,<br />
per cent,<br />
2010-2015<br />
Life<br />
expectancy<br />
at birth,<br />
2010-2015<br />
Total<br />
fertility<br />
rate, per<br />
woman,<br />
2010-2015<br />
Costa Rica 4.8 1.4 77 82 1.8<br />
Côte d'Ivoire 20.6 2.2 55 58 4.2<br />
Croatia 4.4 -0.2 73 80 1.5<br />
Cuba 11.2 0.0 77 81 1.5<br />
Cyprus 1.1 1.1 78 82 1.5<br />
Czech Republic 10.6 0.3 75 81 1.5<br />
Denmark 5.6 0.3 77 81 1.9<br />
Djibouti 0.9 1.9 57 60 3.6<br />
Dominica 0.1 0.0<br />
Dominican Republic 10.2 1.2 71 77 2.5<br />
Ecuador 14.9 1.3 73 79 2.42<br />
Egypt 84.0 1.7 72 76 2.6<br />
El Salvador 6.3 0.6 68 77 2.2<br />
Equatorial Guinea 0.7 2.7 50 53 5.0<br />
Eritrea 5.6 2.9 60 64 4.2<br />
Estonia 1.3 -0.1 70 80 1.7<br />
Ethiopia 86.5 2.1 58 62 3.8<br />
Fiji 0.9 0.8 67 72 2.6<br />
Finland 5.4 0.3 77 83 1.9<br />
France 63.5 0.5 78 85 2.0<br />
Gabon 1.6 1.9 62 64 3.2<br />
Gambia 1.8 2.7 58 60 4.7<br />
Georgia 4.3 -0.6 71 77 1.5<br />
Germany 82.0 -0.2 78 83 1.5<br />
Ghana 25.5 2.3 64 66 4.0<br />
Greece 11.4 0.2 78 83 1.5<br />
Grenada 0.1 0.4 74 78 2.2<br />
Guatemala 15.1 2.5 68 75 3.8<br />
Guinea 10.5 2.5 53 56 5.0<br />
Guinea-Bissau 1.6 2.1 47 50 4.9<br />
Guyana 0.8 0.2 67 73 2.2<br />
Haiti 10.3 1.3 61 64 3.2<br />
Honduras 7.9 2.0 71 76 3.0<br />
Hungary 9.9 -0.2 71 78 1.4<br />
Iceland 0.3 1.2 80 84 2.1<br />
India 1,258.4 1.3 64 68 2.5<br />
Indonesia 244.8 1.0 68 72 2.1<br />
Iran (Islamic<br />
Republic <strong>of</strong>) 75.6 1.0 72 75 1.6<br />
Iraq 33.7 3.1 68 73 4.5<br />
112 INDICATORS