State of World Population 2012 - Country Page List - UNFPA
State of World Population 2012 - Country Page List - UNFPA
State of World Population 2012 - Country Page List - UNFPA
Create successful ePaper yourself
Turn your PDF publications into a flip-book with our unique Google optimized e-Paper software.
Monitoring ICPD Goals – Selected Indicators<br />
Indicators <strong>of</strong> Mortality Indicators <strong>of</strong> Education Reproductive Health Indicators<br />
birth rate measures the annual Infant number Life <strong>of</strong> expectancy births to women Maternal 15 to 19 Primary enrolment union. Proportion For further Secondary analysis, see % Illiterate also Adding it Births Up: per Cost Contraceptive and Benefits <strong>of</strong> HIV<br />
mortality M/F<br />
mortality (gross) M/F reaching grade 5 enrolment (>15 years) 1,000 Prevalence<br />
prevalence<br />
years <strong>of</strong> age per 1,000 women in that age group. It represents the risk Contraceptive Services: Estimates for <strong>2012</strong>. Guttmacher Institute<br />
Total per<br />
ratio<br />
M/F<br />
(gross) M/F M/F<br />
women<br />
rate (%)<br />
1,000 live<br />
aged<br />
Any Modern<br />
<strong>of</strong> childbearing among adolescent women 15 to 19 years <strong>of</strong> age. For civil and <strong>UNFPA</strong>.<br />
(15-49)<br />
births<br />
15-19<br />
method methods<br />
M/F<br />
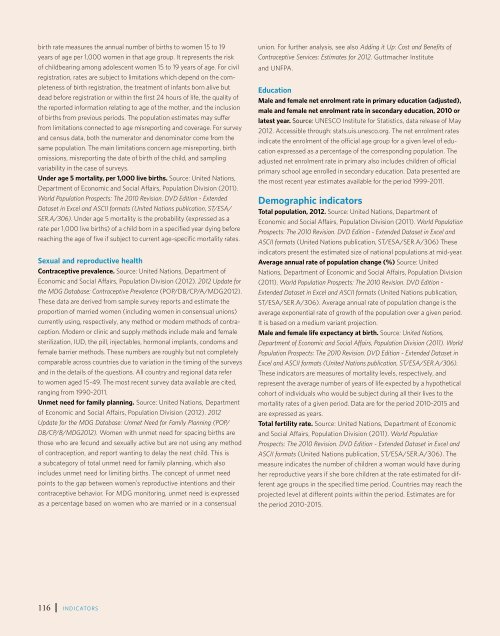
registration, rates are subject to limitations which depend on the completeness<br />
<strong>of</strong> birth registration, the treatment <strong>of</strong> infants born alive but<br />
dead before registration or within the first 24 hours <strong>of</strong> life, the quality <strong>of</strong><br />
the reported information relating to age <strong>of</strong> the mother, and the inclusion<br />
<strong>of</strong> births from previous periods. The population estimates may suffer<br />
from limitations connected to age misreporting and coverage. For survey<br />
and census data, both the numerator and denominator come from the<br />
same population. The main limitations concern age misreporting, birth<br />
omissions, misreporting the date <strong>of</strong> birth <strong>of</strong> the child, and sampling<br />
variability in the case <strong>of</strong> surveys.<br />
Under age 5 mortality, per 1,000 live births. Source: United Nations,<br />
Education<br />
Male and female net enrolment rate in primary education (adjusted),<br />
male and female net enrolment rate in secondary education, 2010 or<br />
latest year. Source: UNESCO Institute for Statistics, data release <strong>of</strong> May<br />
<strong>2012</strong>. Accessible through: stats.uis.unesco.org. The net enrolment rates<br />
indicate the enrolment <strong>of</strong> the <strong>of</strong>ficial age group for a given level <strong>of</strong> education<br />
expressed as a percentage <strong>of</strong> the corresponding population. The<br />
adjusted net enrolment rate in primary also includes children <strong>of</strong> <strong>of</strong>ficial<br />
primary school age enrolled in secondary education. Data presented are<br />
the most recent year estimates available for the period 1999-2011.<br />
Department <strong>of</strong> Economic and Social Affairs, <strong>Population</strong> Division (2011).<br />
<strong>World</strong> <strong>Population</strong> Prospects: The 2010 Revision. DVD Edition - Extended<br />
Dataset in Excel and ASCII formats (United Nations publication, ST/ESA/<br />
SER.A/306). Under age 5 mortality is the probability (expressed as a<br />
rate per 1,000 live births) <strong>of</strong> a child born in a specified year dying before<br />
reaching the age <strong>of</strong> five if subject to current age-specific mortality rates.<br />
Demographic indicators<br />
Total population, <strong>2012</strong>. Source: United Nations, Department <strong>of</strong><br />
Economic and Social Affairs, <strong>Population</strong> Division (2011). <strong>World</strong> <strong>Population</strong><br />
Prospects: The 2010 Revision. DVD Edition - Extended Dataset in Excel and<br />
ASCII formats (United Nations publication, ST/ESA/SER.A/306) These<br />
indicators present the estimated size <strong>of</strong> national populations at mid-year.<br />
Sexual and reproductive health<br />
Contraceptive prevalence. Source: United Nations, Department <strong>of</strong><br />
Economic and Social Affairs, <strong>Population</strong> Division (<strong>2012</strong>). <strong>2012</strong> Update for<br />
the MDG Database: Contraceptive Prevalence (POP/DB/CP/A/MDG<strong>2012</strong>).<br />
These data are derived from sample survey reports and estimate the<br />
proportion <strong>of</strong> married women (including women in consensual unions)<br />
currently using, respectively, any method or modern methods <strong>of</strong> contraception.<br />
Modern or clinic and supply methods include male and female<br />
sterilization, IUD, the pill, injectables, hormonal implants, condoms and<br />
female barrier methods. These numbers are roughly but not completely<br />
comparable across countries due to variation in the timing <strong>of</strong> the surveys<br />
and in the details <strong>of</strong> the questions. All country and regional data refer<br />
to women aged 15-49. The most recent survey data available are cited,<br />
ranging from 1990-2011.<br />
Unmet need for family planning. Source: United Nations, Department<br />
<strong>of</strong> Economic and Social Affairs, <strong>Population</strong> Division (<strong>2012</strong>). <strong>2012</strong><br />
Update for the MDG Database: Unmet Need for Family Planning (POP/<br />
DB/CP/B/MDG<strong>2012</strong>). Women with unmet need for spacing births are<br />
those who are fecund and sexually active but are not using any method<br />
<strong>of</strong> contraception, and report wanting to delay the next child. This is<br />
a subcategory <strong>of</strong> total unmet need for family planning, which also<br />
includes unmet need for limiting births. The concept <strong>of</strong> unmet need<br />
points to the gap between women's reproductive intentions and their<br />
contraceptive behavior. For MDG monitoring, unmet need is expressed<br />
as a percentage based on women who are married or in a consensual<br />
Average annual rate <strong>of</strong> population change (%) Source: United<br />
Nations, Department <strong>of</strong> Economic and Social Affairs, <strong>Population</strong> Division<br />
(2011). <strong>World</strong> <strong>Population</strong> Prospects: The 2010 Revision. DVD Edition -<br />
Extended Dataset in Excel and ASCII formats (United Nations publication,<br />
ST/ESA/SER.A/306). Average annual rate <strong>of</strong> population change is the<br />
average exponential rate <strong>of</strong> growth <strong>of</strong> the population over a given period.<br />
It is based on a medium variant projection.<br />
Male and female life expectancy at birth. Source: United Nations,<br />
Department <strong>of</strong> Economic and Social Affairs, <strong>Population</strong> Division (2011). <strong>World</strong><br />
<strong>Population</strong> Prospects: The 2010 Revision. DVD Edition - Extended Dataset in<br />
Excel and ASCII formats (United Nations publication, ST/ESA/SER.A/306).<br />
These indicators are measures <strong>of</strong> mortality levels, respectively, and<br />
represent the average number <strong>of</strong> years <strong>of</strong> life expected by a hypothetical<br />
cohort <strong>of</strong> individuals who would be subject during all their lives to the<br />
mortality rates <strong>of</strong> a given period. Data are for the period 2010-2015 and<br />
are expressed as years.<br />
Total fertility rate. Source: United Nations, Department <strong>of</strong> Economic<br />
and Social Affairs, <strong>Population</strong> Division (2011). <strong>World</strong> <strong>Population</strong><br />
Prospects: The 2010 Revision. DVD Edition - Extended Dataset in Excel and<br />
ASCII formats (United Nations publication, ST/ESA/SER.A/306). The<br />
measure indicates the number <strong>of</strong> children a woman would have during<br />
her reproductive years if she bore children at the rate estimated for different<br />
age groups in the specified time period. Countries may reach the<br />
projected level at different points within the period. Estimates are for<br />
the period 2010-2015.<br />
116 INDICATORS


