Tracking External Donor Funding.pdf - NDC
Tracking External Donor Funding.pdf - NDC
Tracking External Donor Funding.pdf - NDC

Create successful ePaper yourself
Turn your PDF publications into a flip-book with our unique Google optimized e-Paper software.
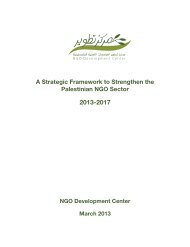
Figure 34: Location of International Aid Agencies by Region (2008)<br />
5%<br />
5%<br />
6%<br />
84%<br />
Source: PASSIA Diaries, 2009<br />
N WB C WB S WB GS<br />
The Central West Bank<br />
Within the Central West Bank, we tried to analyze<br />
changes in the preferences of donors between Ramallah<br />
and Jerusalem over a ten year period. As the two cities<br />
are located next to each other, and both are important<br />
centers of political activity, it was expected that the<br />
trends would be negatively related. That is, a decrease in<br />
the number of agencies in one city would mean an<br />
increase in the number of the other. We also tried to<br />
measure the impact of Israel’s construction of the<br />
Separation Wall in 2002, with the assumption that it<br />
would lead to significant fluctuations in the percentages<br />
of NGOs working in either city as restrictions and<br />
obstacles to movement increased.<br />
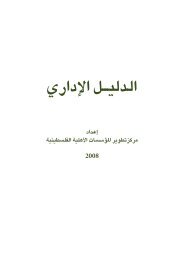
However, as the Figure 35 below shows, from 2002 until<br />
2006, the percentages of agencies located in either city<br />
remains relatively stable. One possible explanation for<br />
this has already been discussed. Namely, the fact that<br />
movement restrictions do not affect international<br />
agencies in the same way that they do Palestinian ones,<br />
allowed international organizations to stay put<br />
throughout the Wall’s construction.<br />
Figure 35: <strong>External</strong> <strong>Donor</strong> and Agency Distribution<br />
in the Central West Bank (1999 – 2008)<br />
70%<br />
60%<br />
50%<br />
40%<br />
30%<br />
20%<br />
10%<br />
0%<br />
1999 2000 2001 2002 2003 2004 2005 2006 2007 2008<br />
Ramallah-Bireh Jerusalem Jericho<br />
Source: PASSIA Directory, 2000 – 2009<br />
Note: The numbers do not add up to 100% because the graph excludes the HQs of<br />
donors in other regions of the WB&GS<br />
50