FORM 20-F Grupo Casa Saba, S.A.B. de C.V.
FORM 20-F Grupo Casa Saba, S.A.B. de C.V.
FORM 20-F Grupo Casa Saba, S.A.B. de C.V.

You also want an ePaper? Increase the reach of your titles
YUMPU automatically turns print PDFs into web optimized ePapers that Google loves.
Table of Contents<br />
Results of Operations<br />
In accordance with Mexican FRS, Peso amounts presented below are expressed in nominal terms.<br />
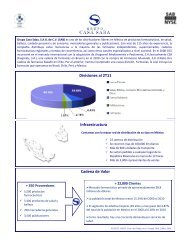
As a result of the incorporation of FASA’s sales as of October <strong>20</strong>10, the Group’s overall sales have increased. In <strong>20</strong>11, the retail division posted gains versus its <strong>20</strong>10<br />
sales. This increase was primarily the result of an increase in the number of stores in Mexico and Chile as well as improvements in our efficiency at the store level.<br />
Year En<strong>de</strong>d December 31, <strong>20</strong>11 Compared to Year En<strong>de</strong>d December 31, <strong>20</strong>10<br />
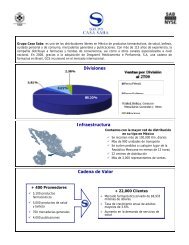
In September <strong>20</strong>10, the company acquired 97.8% of Farmacias Ahumada, S.A. (FASA), a chain of more than 1,260 pharmacies with operations in Chile, Mexico and<br />
Peru. Therefore, GCS consolidated figures for <strong>20</strong>10 incorporate three months figures of FASA. In <strong>20</strong>11 the company consolidated 12 months of FASA, thus, comparison for the full year<br />
are not comparable. The majority of the <strong>20</strong>11 figures are not comparable with those that were reported in previous years. The following chart <strong>de</strong>scribes the figures for GCS and FASA<br />
and the Consolidated net amount for <strong>20</strong>11:<br />
Consolidated<br />
Group FASA Net amount<br />
(Amounts in millions of Mexican pesos)<br />
Net sales Ps. 46,568.2 Ps. 19,139.8 Ps. 27,428.4<br />
Gross Profit 8,774.2 4,711.8 4,062.4<br />
Operating income 1,566.4 522.0 1,044.4<br />
Total Net Sales. <strong>Grupo</strong> <strong>Casa</strong> <strong>Saba</strong>’s total net sales amounted to Ps. 46,568.23 million for the year en<strong>de</strong>d December 31, <strong>20</strong>11, an increase of 37.61% as compared to the<br />
same period of <strong>20</strong>10. The increase was primarily due to the addition of FASA’s sales. Excluding FASA, sales for GCS would have <strong>de</strong>creased 8.46%, due to lower sales to some<br />
supermarket chains, some regional and traditional clients, as well as lower sales from our publication division, Citem. This <strong>de</strong>crease is affected by the elimination of the sales from <strong>Casa</strong>s<br />
<strong>Saba</strong> to Benavi<strong>de</strong>s (a subsidiary of FASA) which during <strong>20</strong>11 accounted for $2,996.9 million and in <strong>20</strong>10 for $723.94 (please note that this figure only reflects sales from Oct - December).<br />
However, this <strong>de</strong>crease was partially offset by an increase of 26% in sales from our Government Pharma business division due to a higher participation in bidding processes.<br />
Sales by Division: Net Private Pharma Sales. Net sales from our Private Pharma business division went from Ps. 24,335.4 million for the year en<strong>de</strong>d December 31, <strong>20</strong>10<br />
to Ps. 21,497.2 million for the year en<strong>de</strong>d December 31, <strong>20</strong>11, a <strong>de</strong>crease of 11.7%, due to lower sales to some supermarket chains and some regional and traditional clients. This <strong>de</strong>crease<br />
was affected by the elimination of the sales from <strong>Casa</strong>s <strong>Saba</strong> to Benavi<strong>de</strong>s (a subsidiary of FASA), which during <strong>20</strong>11 accounted for $2,996.9 million and in <strong>20</strong>10 for $723.94 (please note<br />
that this figure only reflects sales from Oct - December). As a result, this division’s sales represented 46.2% of the Group’s total net sales.<br />
Net Government Pharma Sales. Net sales from our Government Pharma business division rose 26% with respect to <strong>20</strong>10, increasing from Ps. 959.3 million for the year<br />
en<strong>de</strong>d December 31, <strong>20</strong>10 to Ps. 1,<strong>20</strong>9.1 million for the year en<strong>de</strong>d December 31, <strong>20</strong>11. The increase in sales reflects a higher participation in bidding processes during the period to<br />
various fe<strong>de</strong>ral and state government health institutions. Government Pharma sales represented 2.6% of the Group’s total net sales in <strong>20</strong>11.<br />
Net Health, Beauty, Consumer Goods, General Merchandise and Other Sales. Net sales from our Health, Beauty, Consumer Goods, General Merchandise and Other<br />
business division were Ps. 2,421.8 million for the year en<strong>de</strong>d December 31, <strong>20</strong>11 compared to Ps. 2,173.6 million for the year en<strong>de</strong>d December 31, <strong>20</strong>10. This increase was mainly due to a<br />
higher <strong>de</strong>mand for these types of products in the different markets where we offer them. Net sales by this division represented 5.2% of our total <strong>20</strong>11 net sales.<br />
Net Publication Sales. Net sales from our Publications business division <strong>de</strong>creased 5.2% due to the we received fewer copies of some magazine titles from some of<br />
our publishers, as well as a reduction in the overall number of publications distributed. Sales went from Ps. 835.6 million for the year en<strong>de</strong>d December 31, <strong>20</strong>10 to Ps. 792.6 million for the<br />
year en<strong>de</strong>d December 31, <strong>20</strong>11 and accounted for 1.7% of our total net sales.<br />
66