Trust Recovery Growth Vitalization - Marubeni
Trust Recovery Growth Vitalization - Marubeni
Trust Recovery Growth Vitalization - Marubeni

Create successful ePaper yourself
Turn your PDF publications into a flip-book with our unique Google optimized e-Paper software.
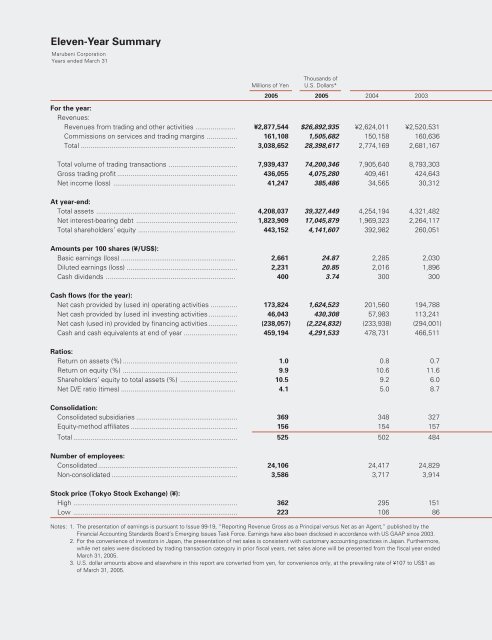
Eleven-Year Summary<br />
<strong>Marubeni</strong> Corporation<br />
Years ended March 31<br />
Millions of Yen<br />
Thousands of<br />
U.S. Dollars*<br />
2005 2005 2004 2003<br />
For the year:<br />
Revenues:<br />
Revenues from trading and other activities ..................... ¥2,877,544 $26,892,935 ¥2,624,011 ¥2,520,531<br />
Commissions on services and trading margins ................ 161,108 1,505,682 150,158 160,636<br />
Total ................................................................................. 3,038,652 28,398,617 2,774,169 2,681,167<br />
Total volume of trading transactions .................................... 7,939,437 74,200,346 7,905,640 8,793,303<br />
Gross trading profit ............................................................... 436,055 4,075,280 409,461 424,643<br />
Net income (loss) ................................................................ 41,247 385,486 34,565 30,312<br />
At year-end:<br />
Total assets ......................................................................... 4,208,037 39,327,449 4,254,194 4,321,482<br />
Net interest-bearing debt ..................................................... 1,823,909 17,045,879 1,969,323 2,264,117<br />
Total shareholders’ equity ................................................... 443,152 4,141,607 392,982 260,051<br />
Amounts per 100 shares (¥/US$):<br />
Basic earnings (loss) ............................................................ 2,661 24.87 2,285 2,030<br />
Diluted earnings (loss) .......................................................... 2,231 20.85 2,016 1,896<br />
Cash dividends .................................................................... 400 3.74 300 300<br />
Cash flows (for the year):<br />
Net cash provided by (used in) operating activities .............. 173,824 1,624,523 201,560 194,788<br />
Net cash provided by (used in) investing activities ............... 46,043 430,308 57,983 113,241<br />
Net cash (used in) provided by financing activities ............... (238,057) (2,224,832) (233,938) (294,001)<br />
Cash and cash equivalents at end of year ............................ 459,194 4,291,533 478,731 466,511<br />
Ratios:<br />
Return on assets (%) ............................................................ 1.0 0.8 0.7<br />
Return on equity (%) ............................................................ 9.9 10.6 11.6<br />
Shareholders’ equity to total assets (%) .............................. 10.5 9.2 6.0<br />
Net D/E ratio (times) ............................................................ 4.1 5.0 8.7<br />
Consolidation:<br />
Consolidated subsidiaries ..................................................... 369 348 327<br />
Equity-method affiliates ........................................................ 156 154 157<br />
Total ...................................................................................... 525 502 484<br />
Number of employees:<br />
Consolidated ......................................................................... 24,106 24,417 24,829<br />
Non-consolidated .................................................................. 3,586 3,717 3,914<br />
Stock price (Tokyo Stock Exchange) (¥):<br />
High ...................................................................................... 362 295 151<br />
Low ...................................................................................... 223 106 86<br />
Notes: 1. The presentation of earnings is pursuant to Issue 99-19, “Reporting Revenue Gross as a Principal versus Net as an Agent,” published by the<br />
Financial Accounting Standards Board’s Emerging Issues Task Force. Earnings have also been disclosed in accordance with US GAAP since 2003.<br />
2. For the convenience of investors in Japan, the presentation of net sales is consistent with customary accounting practices in Japan. Furthermore,<br />
while net sales were disclosed by trading transaction category in prior fiscal years, net sales alone will be presented from the fiscal year ended<br />
March 31, 2005.<br />
3. U.S. dollar amounts above and elsewhere in this report are converted from yen, for convenience only, at the prevailing rate of ¥107 to US$1 as<br />
of March 31, 2005.

![[Chapter 2] Driving Growth: Expansion Under SG-12 - Marubeni](https://img.yumpu.com/4161147/1/190x248/chapter-2-driving-growth-expansion-under-sg-12-marubeni.jpg?quality=85)
![[Chapter 4] Delivering Growth - Marubeni](https://img.yumpu.com/3464783/1/190x248/chapter-4-delivering-growth-marubeni.jpg?quality=85)