Trust Recovery Growth Vitalization - Marubeni
Trust Recovery Growth Vitalization - Marubeni
Trust Recovery Growth Vitalization - Marubeni

Create successful ePaper yourself
Turn your PDF publications into a flip-book with our unique Google optimized e-Paper software.
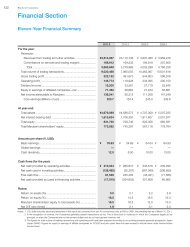
Management’s Discussion and Analysis of Financial Position<br />
and Business Results<br />
All statements herein regarding future events reflect the judgment of <strong>Marubeni</strong> and its consolidated subsidiaries as of March 31, 2005.<br />
1 Financial Review<br />
(1) Operating Environment<br />
During the fiscal year ended March 31, 2005, the global<br />
economy continued to stage a strong recovery, spearheaded by<br />
strong economic growth in the United States and China. Fueled<br />
by these conditions, demand for energy boomed, causing crude<br />
oil prices to jump sharply beginning in the second half of 2004. In<br />
the U.S., the economy grew steadily, supported by strong capital<br />
investment resulting from higher corporate earnings, as well as<br />
by healthy consumer spending. Product prices, meanwhile,<br />
remained stable as the Federal Reserve Board cautiously raised<br />
interest rates. In contrast, the U.S. current account deficit and<br />
fiscal deficit both rose to record-high levels, putting increased<br />
downward pressure on the dollar. Europe’s modest economic<br />
recovery continued, although the gap became more pronounced<br />
between nations where consumer spending was robust, like the<br />
U.K. and France, and those dependent on exports, such as<br />
Germany and Italy. In Asia, economic growth centered on China<br />
remained on track. Despite a slowdown in investments in capital<br />
goods due to more restrictive government policies, increased<br />
exports and consumer spending lifted the annual growth rate for<br />
the Chinese economy to 9.5% in 2004, surpassing the previousyear<br />
figure. As of December 31, 2004, China’s foreign exchange<br />
reserves topped $600 billion, sparking renewed calls from<br />
around the globe for the country to reform its currency exchange<br />
policies. ASEAN nations, Taiwan and Hong Kong all continued to<br />
post growth, helped along by a favorable balance of exports and<br />
domestic demand, while South Korea’s modest export-led<br />
recovery also stayed on course. In India, healthy consumer<br />
spending was the leading factor behind economic growth. In<br />
Russia, as well as Brazil and other South American nations,<br />
economic growth was strong atop sharply higher exports,<br />
benefiting from rising global demand and soaring prices for<br />
primary commodities, as well as growing domestic demand.<br />
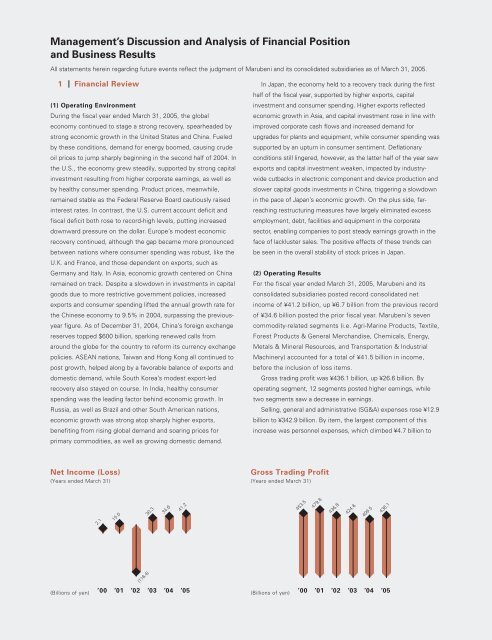
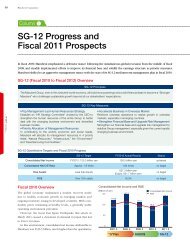
Net Income (Loss)<br />
(Years ended March 31)<br />
(Billions of yen)<br />
2.1<br />
15.0<br />
(116.4)<br />
30.3<br />
34.6<br />
41.2<br />
’00 ’01 ’02 ’03 ’04 ’05<br />
In Japan, the economy held to a recovery track during the first<br />
half of the fiscal year, supported by higher exports, capital<br />
investment and consumer spending. Higher exports reflected<br />
economic growth in Asia, and capital investment rose in line with<br />
improved corporate cash flows and increased demand for<br />
upgrades for plants and equipment, while consumer spending was<br />
supported by an upturn in consumer sentiment. Deflationary<br />
conditions still lingered, however, as the latter half of the year saw<br />
exports and capital investment weaken, impacted by industrywide<br />
cutbacks in electronic component and device production and<br />
slower capital goods investments in China, triggering a slowdown<br />
in the pace of Japan’s economic growth. On the plus side, farreaching<br />
restructuring measures have largely eliminated excess<br />
employment, debt, facilities and equipment in the corporate<br />
sector, enabling companies to post steady earnings growth in the<br />
face of lackluster sales. The positive effects of these trends can<br />
be seen in the overall stability of stock prices in Japan.<br />
(2) Operating Results<br />
For the fiscal year ended March 31, 2005, <strong>Marubeni</strong> and its<br />
consolidated subsidiaries posted record consolidated net<br />
income of ¥41.2 billion, up ¥6.7 billion from the previous record<br />
of ¥34.6 billion posted the prior fiscal year. <strong>Marubeni</strong>’s seven<br />
commodity-related segments (i.e. Agri-Marine Products, Textile,<br />
Forest Products & General Merchandise, Chemicals, Energy,<br />
Metals & Mineral Resources, and Transportation & Industrial<br />
Machinery) accounted for a total of ¥41.5 billion in income,<br />
before the inclusion of loss items.<br />
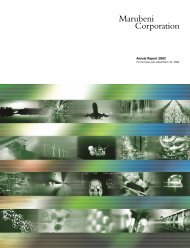
Gross trading profit was ¥436.1 billion, up ¥26.6 billion. By<br />
operating segment, 12 segments posted higher earnings, while<br />
two segments saw a decrease in earnings.<br />
Selling, general and administrative (SG&A) expenses rose ¥12.9<br />
billion to ¥342.9 billion. By item, the largest component of this<br />
increase was personnel expenses, which climbed ¥4.7 billion to<br />
Gross Trading Profit<br />
(Years ended March 31)<br />
(Billions of yen)<br />
453.5<br />
479.8<br />
436.8<br />
424.6<br />
409.5<br />
436.1<br />
’00 ’01 ’02 ’03 ’04 ’05
![[Chapter 2] Driving Growth: Expansion Under SG-12 - Marubeni](https://img.yumpu.com/4161147/1/190x248/chapter-2-driving-growth-expansion-under-sg-12-marubeni.jpg?quality=85)
![[Chapter 4] Delivering Growth - Marubeni](https://img.yumpu.com/3464783/1/190x248/chapter-4-delivering-growth-marubeni.jpg?quality=85)