Trust Recovery Growth Vitalization - Marubeni
Trust Recovery Growth Vitalization - Marubeni
Trust Recovery Growth Vitalization - Marubeni

Create successful ePaper yourself
Turn your PDF publications into a flip-book with our unique Google optimized e-Paper software.
agreement was reached for the acquisition of shares in P.T. Mushi<br />
Pulp and its related operations and assets.<br />
Development & Construction transactions were up ¥18.1 billion,<br />
or 10.1%, to ¥196.8 billion, lifted by an increase in domestic real<br />
estate fund brokerage and agency transactions. Gross trading<br />
profit dipped ¥0.4 billion, or 1.4%, to ¥27.5 billion, as lower<br />
transactions from declining condominium sales and the transfer of<br />
domestic construction operations overshadowed higher profits<br />
from overseas residential housing operations.<br />
Finance & Logistics Business transactions increased ¥3.4 billion,<br />
or 19.1%, to ¥21.3 billion, due to higher fund and logistics-related<br />
transactions. Benefiting from higher fund-related transactions,<br />
gross trading profit climbed ¥0.9 billion, or 18.1%, to ¥5.8 billion.<br />
Telecom & Information transactions were up ¥8.1 billion from<br />
the previous year, or 4.8%, to ¥175.8 billion, the result of higher<br />
transactions from communications-related operations. Due to<br />
this growth, gross trading profit rose ¥4.5 billion, or 22.7%, to<br />
¥24.5 billion.<br />
Domestic Branches and Offices transactions, impacted by lower<br />
transactions related to machinery and the transfer of commercial<br />
rights, decreased ¥17.3 billion, or 10.8%, to ¥142.0 billion. Gross<br />
trading profit was ¥4.9 billion, a decline of ¥0.5 billion, or 9.7%,<br />
compared to the previous year.<br />
Overseas Corporate Subsidiaries and Branches transactions<br />
increased ¥34.6 billion, or 3.3% year on year, to ¥1,070.2 billion,<br />
mostly due to higher automobile, construction machinery and<br />
agrochemical-related transactions in the U.S. Gross trading profit<br />
was up ¥3.1 billion, or 4.2%, to ¥76.5 billion, mainly due to higher<br />
earnings from agrochemical-related operations in the U.S.<br />
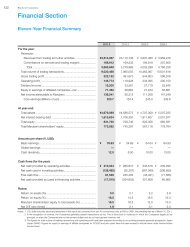
Total Volume of Trading Transactions<br />
by Region<br />
(Years ended March 31)<br />
Billions of Yen<br />
2005 2004<br />
Japan ........................................ ¥6,977.5 ¥6,925.4<br />
North America .......................... 1,025.1 1,430.8<br />
Europe ...................................... 407.0 368.3<br />
Asia & Oceania ......................... 645.9 564.8<br />
Other Regions .......................... 980.5 825.4<br />
Note: Trading transactions have been prepared according to accounting<br />
principles generally accepted in Japan.<br />
(4) Business Results by Geographic Region<br />
Japan<br />
<strong>Marubeni</strong> Corporation 2005<br />
Trading transactions increased ¥52.1 billion, or 0.8%, to ¥6,977.5<br />
billion, mostly from growth in transactions related to Agri-Marine<br />
Products. Operating profit fell ¥16.3 billion, or 32.9%, to ¥33.3<br />
billion, mainly due to a decline in earnings from Utility & Infrastructure<br />
and Plant & Ship-related business.<br />
North America<br />
Trading transactions were down ¥405.7 billion, or 28.4%, to<br />
¥1,025.1 billion, hampered mainly by lower Energy-related<br />
transactions. Operating profit, however, was buoyed by higher<br />
earnings from the same transactions, surging ¥8.2 billion, or<br />
147.2%, to ¥13.8 billion.<br />
Europe<br />
Trading transactions increased ¥38.8 billion, or 10.5%, to ¥407.0<br />
billion, positively influenced primarily by higher transactions from<br />
Utility & Infrastructure-related business. Operating profit, meanwhile,<br />
increased ¥5.2 billion, or 75.9%, to ¥12.1 billion, largely<br />
atop higher earnings from Energy-related transactions.<br />
Asia and Oceania<br />
Trading transactions rose ¥81.1 billion, or 14.4%, to ¥645.9 billion,<br />
primarily due to a higher volume of Chemicals and Utility &<br />
Infrastructure-related business. This higher transaction volume in<br />
Utility & Infrastructure-related business lifted operating profit ¥4.7<br />
billion, or 37.4%, to ¥17.1 billion.<br />
Profitability Comparison of Consolidated<br />
Companies<br />
(Years ended March 31)<br />
(Companies)<br />
480<br />
80.3%<br />
’01 ’02 ’03 ’04 ’05<br />
Profitable companies Unprofitable companies<br />
Percentage of profitable companies<br />
391<br />
(118)<br />
75.9%<br />
375<br />
(124)<br />
77.5%<br />
390<br />
(109)<br />
77.7%<br />
422<br />
(112)<br />
80.4%<br />
(103)<br />
60 / 61
![[Chapter 2] Driving Growth: Expansion Under SG-12 - Marubeni](https://img.yumpu.com/4161147/1/190x248/chapter-2-driving-growth-expansion-under-sg-12-marubeni.jpg?quality=85)

![[Chapter 4] Delivering Growth - Marubeni](https://img.yumpu.com/3464783/1/190x248/chapter-4-delivering-growth-marubeni.jpg?quality=85)