Trust Recovery Growth Vitalization - Marubeni
Trust Recovery Growth Vitalization - Marubeni
Trust Recovery Growth Vitalization - Marubeni

You also want an ePaper? Increase the reach of your titles
YUMPU automatically turns print PDFs into web optimized ePapers that Google loves.
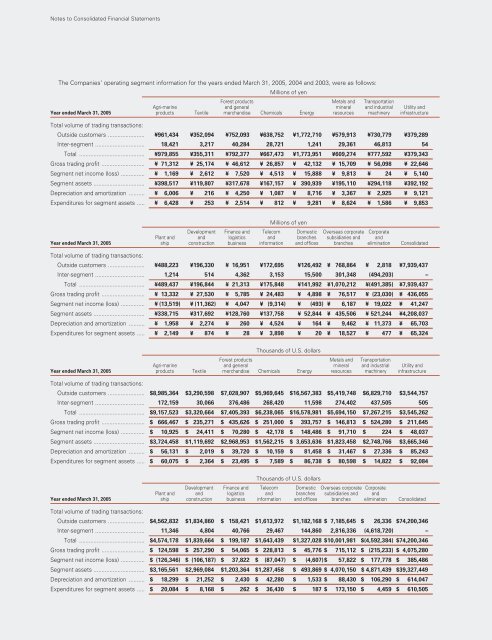
Notes to Consolidated Financial Statements<br />
The Companies’ operating segment information for the years ended March 31, 2005, 2004 and 2003, were as follows:<br />
Millions of yen<br />
Forest products Metals and Transportation<br />
Agri-marine and general mineral and industrial Utility and<br />
Year ended March 31, 2005 products Textile merchandise Chemicals Energy resources machinery infrastructure<br />
Total volume of trading transactions:<br />
Outside customers ....................... ¥961,434 ¥352,094 ¥752,093 ¥638,752 ¥1,772,710 ¥579,913 ¥730,779 ¥379,289<br />
Inter-segment ............................... 18,421 3,217 40,284 28,721 1,241 29,361 46,813 54<br />
Total ......................................... ¥979,855 ¥355,311 ¥792,377 ¥667,473 ¥1,773,951 ¥609,274 ¥777,592 ¥379,343<br />
Gross trading profit ........................... ¥ 71,312 ¥ 25,174 ¥ 46,612 ¥ 26,857 ¥ 42,132 ¥ 15,709 ¥ 56,098 ¥ 22,646<br />
Segment net income (loss) ............... ¥ 1,169 ¥ 2,612 ¥ 7,520 ¥ 4,513 ¥ 15,888 ¥ 9,813 ¥ 24 ¥ 5,140<br />
Segment assets ................................ ¥398,517 ¥119,807 ¥317,678 ¥167,157 ¥ 390,939 ¥195,110 ¥294,118 ¥392,192<br />
Depreciation and amortization .......... ¥ 6,006 ¥ 216 ¥ 4,250 ¥ 1,087 ¥ 8,716 ¥ 3,367 ¥ 2,925 ¥ 9,121<br />
Expenditures for segment assets ..... ¥ 6,428 ¥ 253 ¥ 2,514 ¥ 812 ¥ 9,281 ¥ 8,624 ¥ 1,586 ¥ 9,853<br />
Millions of yen<br />
Development Finance and Telecom Domestic Overseas corporate Corporate<br />
Plant and and logistics and branches subsidiaries and and<br />
Year ended March 31, 2005 ship construction business information and offices branches elimination Consolidated<br />
Total volume of trading transactions:<br />
Outside customers ....................... ¥488,223 ¥196,330 ¥ 16,951 ¥172,695 ¥126,492 ¥ 768,864 ¥ 2,818 ¥7,939,437<br />
Inter-segment ............................... 1,214 514 4,362 3,153 15,500 301,348 (494,203) –<br />
Total ......................................... ¥489,437 ¥196,844 ¥ 21,313 ¥175,848 ¥141,992 ¥1,070,212 ¥(491,385) ¥7,939,437<br />
Gross trading profit ........................... ¥ 13,332 ¥ 27,530 ¥ 5,785 ¥ 24,483 ¥ 4,898 ¥ 76,517 ¥ (23,030) ¥ 436,055<br />
Segment net income (loss) ............... ¥ (13,519) ¥ (11,362) ¥ 4,047 ¥ (9,314) ¥ (493) ¥ 6,187 ¥ 19,022 ¥ 41,247<br />
Segment assets ................................ ¥338,715 ¥317,692 ¥128,760 ¥137,758 ¥ 52,844 ¥ 435,506 ¥ 521,244 ¥4,208,037<br />
Depreciation and amortization .......... ¥ 1,958 ¥ 2,274 ¥ 260 ¥ 4,524 ¥ 164 ¥ 9,462 ¥ 11,373 ¥ 65,703<br />
Expenditures for segment assets ..... ¥ 2,149 ¥ 874 ¥ 28 ¥ 3,898 ¥ 20 ¥ 18,527 ¥ 477 ¥ 65,324<br />
Thousands of U.S. dollars<br />
Forest products Metals and Transportation<br />
Agri-marine and general mineral and industrial Utility and<br />
Year ended March 31, 2005 products Textile merchandise Chemicals Energy resources machinery infrastructure<br />
Total volume of trading transactions:<br />
Outside customers ....................... $8,985,364 $3,290,598 $7,028,907 $5,969,645 $16,567,383 $5,419,748 $6,829,710 $3,544,757<br />
Inter-segment ............................... 172,159 30,066 376,486 268,420 11,598 274,402 437,505 505<br />
Total ......................................... $9,157,523 $3,320,664 $7,405,393 $6,238,065 $16,578,981 $5,694,150 $7,267,215 $3,545,262<br />
Gross trading profit ........................... $ 666,467 $ 235,271 $ 435,626 $ 251,000 $ 393,757 $ 146,813 $ 524,280 $ 211,645<br />
Segment net income (loss) ............... $ 10,925 $ 24,411 $ 70,280 $ 42,178 $ 148,486 $ 91,710 $ 224 $ 48,037<br />
Segment assets ................................ $3,724,458 $1,119,692 $2,968,953 $1,562,215 $ 3,653,636 $1,823,458 $2,748,766 $3,665,346<br />
Depreciation and amortization .......... $ 56,131 $ 2,019 $ 39,720 $ 10,159 $ 81,458 $ 31,467 $ 27,336 $ 85,243<br />
Expenditures for segment assets ..... $ 60,075 $ 2,364 $ 23,495 $ 7,589 $ 86,738 $ 80,598 $ 14,822 $ 92,084<br />
Thousands of U.S. dollars<br />
Development Finance and Telecom Domestic Overseas corporate Corporate<br />
Plant and and logistics and branches subsidiaries and and<br />
Year ended March 31, 2005 ship construction business information and offices branches elimination Consolidated<br />
Total volume of trading transactions:<br />
Outside customers ....................... $4,562,832 $1,834,860 $ 158,421 $1,613,972 $1,182,168 $ 7,185,645 $ 26,336 $74,200,346<br />
Inter-segment ............................... 11,346 4,804 40,766 29,467 144,860 2,816,336 (4,618,720) –<br />
Total ......................................... $4,574,178 $1,839,664 $ 199,187 $1,643,439 $1,327,028 $10,001,981 $(4,592,384) $74,200,346<br />
Gross trading profit ........................... $ 124,598 $ 257,290 $ 54,065 $ 228,813 $ 45,776 $ 715,112 $ (215,233) $ 4,075,280<br />
Segment net income (loss) ............... $ (126,346) $ (106,187) $ 37,822 $ (87,047) $ (4,607)$ 57,822 $ 177,778 $ 385,486<br />
Segment assets ................................ $3,165,561 $2,969,084 $1,203,364 $1,287,458 $ 493,869 $ 4,070,150 $ 4,871,439 $39,327,449<br />
Depreciation and amortization .......... $ 18,299 $ 21,252 $ 2,430 $ 42,280 $ 1,533 $ 88,430 $ 106,290 $ 614,047<br />
Expenditures for segment assets ..... $ 20,084 $ 8,168 $ 262 $ 36,430 $ 187 $ 173,150 $ 4,459 $ 610,505
![[Chapter 2] Driving Growth: Expansion Under SG-12 - Marubeni](https://img.yumpu.com/4161147/1/190x248/chapter-2-driving-growth-expansion-under-sg-12-marubeni.jpg?quality=85)

![[Chapter 4] Delivering Growth - Marubeni](https://img.yumpu.com/3464783/1/190x248/chapter-4-delivering-growth-marubeni.jpg?quality=85)