Trust Recovery Growth Vitalization - Marubeni
Trust Recovery Growth Vitalization - Marubeni
Trust Recovery Growth Vitalization - Marubeni

Create successful ePaper yourself
Turn your PDF publications into a flip-book with our unique Google optimized e-Paper software.
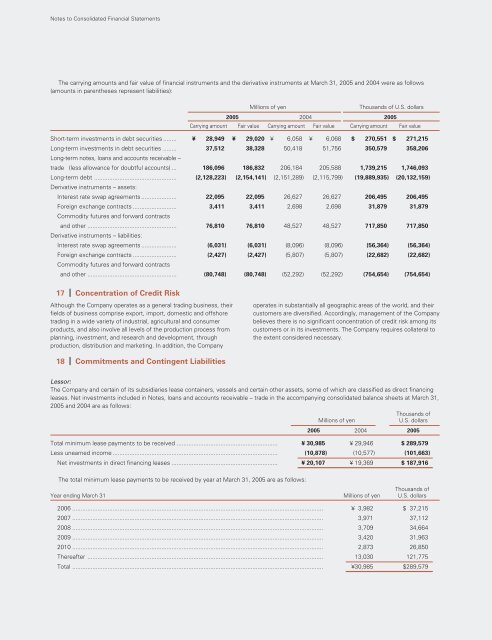
Notes to Consolidated Financial Statements<br />
The carrying amounts and fair value of financial instruments and the derivative instruments at March 31, 2005 and 2004 were as follows<br />
(amounts in parentheses represent liabilities):<br />
Millions of yen Thousands of U.S. dollars<br />
2005 2004 2005<br />
Carrying amount Fair value Carrying amount Fair value Carrying amount Fair value<br />
Short-term investments in debt securities ........ ¥ 28,949 ¥ 29,020 ¥ 6,058 ¥ 6,068 $ 270,551 $ 271,215<br />
Long-term investments in debt securities ........<br />
Long-term notes, loans and accounts receivable –<br />
37,512 38,328 50,418 51,756 350,579 358,206<br />
trade (less allowance for doubtful accounts) ... 186,096 186,832 206,184 205,588 1,739,215 1,746,093<br />
Long-term debt .................................................<br />
Derivative instruments – assets:<br />
(2,128,223) (2,154,141) (2,151,289) (2,115,799) (19,889,935) (20,132,159)<br />
Interest rate swap agreements ..................... 22,095 22,095 26,627 26,627 206,495 206,495<br />
Foreign exchange contracts ..........................<br />
Commodity futures and forward contracts<br />
3,411 3,411 2,698 2,698 31,879 31,879<br />
and other .....................................................<br />
Derivative instruments – liabilities:<br />
76,810 76,810 48,527 48,527 717,850 717,850<br />
Interest rate swap agreements ..................... (6,031) (6,031) (8,096) (8,096) (56,364) (56,364)<br />
Foreign exchange contracts ..........................<br />
Commodity futures and forward contracts<br />
(2,427) (2,427) (5,807) (5,807) (22,682) (22,682)<br />
and other ..................................................... (80,748) (80,748) (52,292) (52,292) (754,654) (754,654)<br />
17 Concentration of Credit Risk<br />
Although the Company operates as a general trading business, their<br />
fields of business comprise export, import, domestic and offshore<br />
trading in a wide variety of industrial, agricultural and consumer<br />
products, and also involve all levels of the production process from<br />
planning, investment, and research and development, through<br />
production, distribution and marketing. In addition, the Company<br />
18 Commitments and Contingent Liabilities<br />
operates in substantially all geographic areas of the world, and their<br />
customers are diversified. Accordingly, management of the Company<br />
believes there is no significant concentration of credit risk among its<br />
customers or in its investments. The Company requires collateral to<br />
the extent considered necessary.<br />
Lessor:<br />
The Company and certain of its subsidiaries lease containers, vessels and certain other assets, some of which are classified as direct financing<br />
leases. Net investments included in Notes, loans and accounts receivable – trade in the accompanying consolidated balance sheets at March 31,<br />
2005 and 2004 are as follows:<br />
Thousands of<br />
Millions of yen U.S. dollars<br />
2005 2004 2005<br />
Total minimum lease payments to be received ............................................................ ¥ 30,985 ¥ 29,946 $ 289,579<br />
Less unearned income .................................................................................................. (10,878) (10,577) (101,663)<br />
Net investments in direct financing leases ............................................................... ¥ 20,107 ¥ 19,369 $ 187,916<br />
The total minimum lease payments to be received by year at March 31, 2005 are as follows:<br />
Year ending March 31 Millions of yen<br />
Thousands of<br />
U.S. dollars<br />
2006 ..................................................................................................................................................... ¥ 3,982 $ 37,215<br />
2007 ..................................................................................................................................................... 3,971 37,112<br />
2008 ..................................................................................................................................................... 3,709 34,664<br />
2009 ..................................................................................................................................................... 3,420 31,963<br />
2010 ..................................................................................................................................................... 2,873 26,850<br />
Thereafter ............................................................................................................................................ 13,030 121,775<br />
Total ..................................................................................................................................................... ¥30,985 $289,579
![[Chapter 2] Driving Growth: Expansion Under SG-12 - Marubeni](https://img.yumpu.com/4161147/1/190x248/chapter-2-driving-growth-expansion-under-sg-12-marubeni.jpg?quality=85)
![[Chapter 4] Delivering Growth - Marubeni](https://img.yumpu.com/3464783/1/190x248/chapter-4-delivering-growth-marubeni.jpg?quality=85)