Trust Recovery Growth Vitalization - Marubeni
Trust Recovery Growth Vitalization - Marubeni
Trust Recovery Growth Vitalization - Marubeni

You also want an ePaper? Increase the reach of your titles
YUMPU automatically turns print PDFs into web optimized ePapers that Google loves.
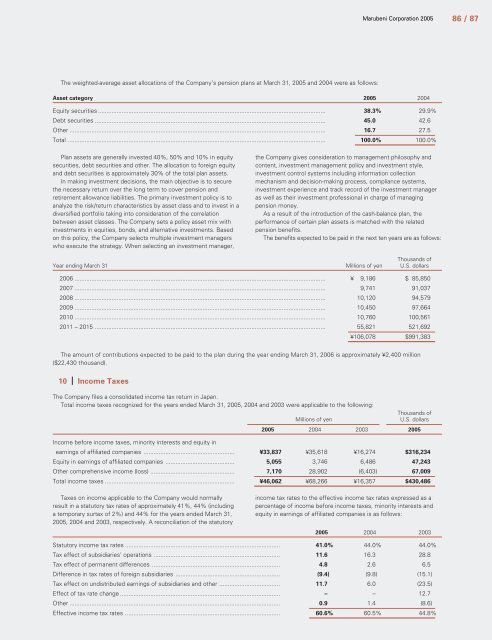
The weighted-average asset allocations of the Company’s pension plans at March 31, 2005 and 2004 were as follows:<br />
<strong>Marubeni</strong> Corporation 2005 86 / 87<br />
Asset category 2005 2004<br />
Equity securities ....................................................................................................................................... 38.3% 29.9%<br />
Debt securities ......................................................................................................................................... 45.0 42.6<br />
Other ........................................................................................................................................................ 16.7 27.5<br />
Total ......................................................................................................................................................... 100.0% 100.0%<br />
Plan assets are generally invested 40%, 50% and 10% in equity<br />
securities, debt securities and other. The allocation to foreign equity<br />
and debt securities is approximately 30% of the total plan assets.<br />
In making investment decisions, the main objective is to secure<br />
the necessary return over the long term to cover pension and<br />
retirement allowance liabilities. The primary investment policy is to<br />
analyze the risk/return characteristics by asset class and to invest in a<br />
diversified portfolio taking into consideration of the correlation<br />
between asset classes. The Company sets a policy asset mix with<br />
investments in equities, bonds, and alternative investments. Based<br />
on this policy, the Company selects multiple investment managers<br />
who execute the strategy. When selecting an investment manager,<br />
the Company gives consideration to management philosophy and<br />
content, investment management policy and investment style,<br />
investment control systems including information collection<br />
mechanism and decision-making process, compliance systems,<br />
investment experience and track record of the investment manager<br />
as well as their investment professional in charge of managing<br />
pension money.<br />
As a result of the introduction of the cash-balance plan, the<br />
performance of certain plan assets is matched with the related<br />
pension benefits.<br />
The benefits expected to be paid in the next ten years are as follows:<br />
Thousands of<br />
Year ending March 31 Millions of yen U.S. dollars<br />
2006 ..................................................................................................................................................... ¥ 9,186 $ 85,850<br />
2007 ..................................................................................................................................................... 9,741 91,037<br />
2008 ..................................................................................................................................................... 10,120 94,579<br />
2009 ..................................................................................................................................................... 10,450 97,664<br />
2010 ..................................................................................................................................................... 10,760 100,561<br />
2011 – 2015 ......................................................................................................................................... 55,821 521,692<br />
¥106,078 $991,383<br />
The amount of contributions expected to be paid to the plan during the year ending March 31, 2006 is approximately ¥2,400 million<br />
($22,430 thousand).<br />
10 Income Taxes<br />
The Company files a consolidated income tax return in Japan.<br />
Total income taxes recognized for the years ended March 31, 2005, 2004 and 2003 were applicable to the following:<br />
Millions of yen<br />
Thousands of<br />
U.S. dollars<br />
2005 2004 2003 2005<br />
Income before income taxes, minority interests and equity in<br />
earnings of affiliated companies ...................................................... ¥33,837 ¥35,618 ¥16,274 $316,234<br />
Equity in earnings of affiliated companies ......................................... 5,055 3,746 6,486 47,243<br />
Other comprehensive income (loss) .................................................. 7,170 28,902 (6,403) 67,009<br />
Total income taxes ............................................................................. ¥46,062 ¥68,266 ¥16,357 $430,486<br />
Taxes on income applicable to the Company would normally<br />
result in a statutory tax rates of approximately 41%, 44% (including<br />
a temporary surtax of 2%) and 44% for the years ended March 31,<br />
2005, 2004 and 2003, respectively. A reconciliation of the statutory<br />
income tax rates to the effective income tax rates expressed as a<br />
percentage of income before income taxes, minority interests and<br />
equity in earnings of affiliated companies is as follows:<br />
2005 2004 2003<br />
Statutory income tax rates ............................................................................................ 41.0% 44.0% 44.0%<br />
Tax effect of subsidiaries’ operations ........................................................................... 11.6 16.3 28.8<br />
Tax effect of permanent differences ............................................................................ 4.8 2.6 6.5<br />
Difference in tax rates of foreign subsidiaries .............................................................. (9.4) (9.8) (15.1)<br />
Tax effect on undistributed earnings of subsidiaries and other .................................... 11.7 6.0 (23.5)<br />
Effect of tax rate change ............................................................................................... – – 12.7<br />
Other ............................................................................................................................. 0.9 1.4 (8.6)<br />
Effective income tax rates ............................................................................................ 60.6% 60.5% 44.8%


![[Chapter 2] Driving Growth: Expansion Under SG-12 - Marubeni](https://img.yumpu.com/4161147/1/190x248/chapter-2-driving-growth-expansion-under-sg-12-marubeni.jpg?quality=85)
![[Chapter 4] Delivering Growth - Marubeni](https://img.yumpu.com/3464783/1/190x248/chapter-4-delivering-growth-marubeni.jpg?quality=85)