Trust Recovery Growth Vitalization - Marubeni
Trust Recovery Growth Vitalization - Marubeni
Trust Recovery Growth Vitalization - Marubeni

Create successful ePaper yourself
Turn your PDF publications into a flip-book with our unique Google optimized e-Paper software.
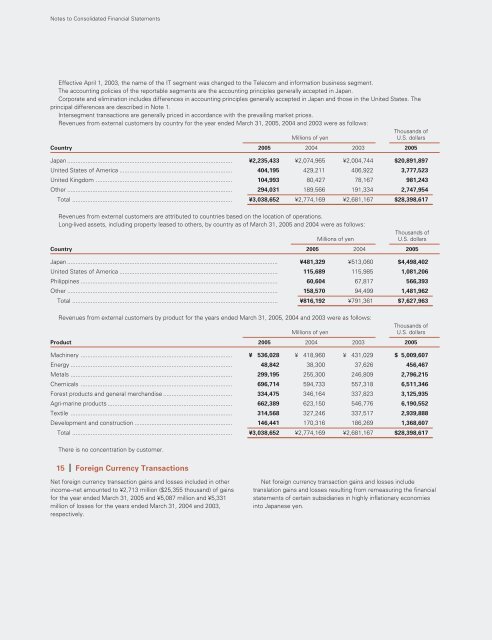
Notes to Consolidated Financial Statements<br />
Effective April 1, 2003, the name of the IT segment was changed to the Telecom and information business segment.<br />
The accounting policies of the reportable segments are the accounting principles generally accepted in Japan.<br />
Corporate and elimination includes differences in accounting principles generally accepted in Japan and those in the United States. The<br />
principal differences are described in Note 1.<br />
Intersegment transactions are generally priced in accordance with the prevailing market prices.<br />
Revenues from external customers by country for the year ended March 31, 2005, 2004 and 2003 were as follows:<br />
Thousands of<br />
Millions of yen U.S. dollars<br />
Country 2005 2004 2003 2005<br />
Japan .................................................................................................. ¥2,235,433 ¥2,074,965 ¥2,004,744 $20,891,897<br />
United States of America ................................................................... 404,195 429,211 406,922 3,777,523<br />
United Kingdom ................................................................................. 104,993 80,427 78,167 981,243<br />
Other .................................................................................................. 294,031 189,566 191,334 2,747,954<br />
Total ............................................................................................... ¥3,038,652 ¥2,774,169 ¥2,681,167 $28,398,617<br />
Revenues from external customers are attributed to countries based on the location of operations.<br />
Long-lived assets, including property leased to others, by country as of March 31, 2005 and 2004 were as follows:<br />
Millions of yen<br />
Thousands of<br />
U.S. dollars<br />
Country 2005 2004 2005<br />
Japan ............................................................................................................................. ¥481,329 ¥513,060 $4,498,402<br />
United States of America .............................................................................................. 115,689 115,985 1,081,206<br />
Philippines ..................................................................................................................... 60,604 67,817 566,393<br />
Other ............................................................................................................................. 158,570 94,499 1,481,962<br />
Total .......................................................................................................................... ¥816,192 ¥791,361 $7,627,963<br />
Revenues from external customers by product for the years ended March 31, 2005, 2004 and 2003 were as follows:<br />
Millions of yen<br />
Thousands of<br />
U.S. dollars<br />
Product 2005 2004 2003 2005<br />
Machinery .......................................................................................... ¥ 536,028 ¥ 418,960 ¥ 431,029 $ 5,009,607<br />
Energy ................................................................................................ 48,842 38,300 37,626 456,467<br />
Metals ................................................................................................ 299,195 255,300 246,809 2,796,215<br />
Chemicals .......................................................................................... 696,714 594,733 557,318 6,511,346<br />
Forest products and general merchandise ......................................... 334,475 346,164 337,823 3,125,935<br />
Agri-marine products .......................................................................... 662,389 623,150 546,776 6,190,552<br />
Textile ................................................................................................ 314,568 327,246 337,517 2,939,888<br />
Development and construction .......................................................... 146,441 170,316 186,269 1,368,607<br />
Total ............................................................................................... ¥3,038,652 ¥2,774,169 ¥2,681,167 $28,398,617<br />
There is no concentration by customer.<br />
15 Foreign Currency Transactions<br />
Net foreign currency transaction gains and losses included in other<br />
income–net amounted to ¥2,713 million ($25,355 thousand) of gains<br />
for the year ended March 31, 2005 and ¥5,087 million and ¥5,331<br />
million of losses for the years ended March 31, 2004 and 2003,<br />
respectively.<br />
Net foreign currency transaction gains and losses include<br />
translation gains and losses resulting from remeasuring the financial<br />
statements of certain subsidiaries in highly inflationary economies<br />
into Japanese yen.
![[Chapter 2] Driving Growth: Expansion Under SG-12 - Marubeni](https://img.yumpu.com/4161147/1/190x248/chapter-2-driving-growth-expansion-under-sg-12-marubeni.jpg?quality=85)


![[Chapter 4] Delivering Growth - Marubeni](https://img.yumpu.com/3464783/1/190x248/chapter-4-delivering-growth-marubeni.jpg?quality=85)