Trust Recovery Growth Vitalization - Marubeni
Trust Recovery Growth Vitalization - Marubeni
Trust Recovery Growth Vitalization - Marubeni

You also want an ePaper? Increase the reach of your titles
YUMPU automatically turns print PDFs into web optimized ePapers that Google loves.
Management’s Discussion and Analysis of Financial Position and Business Results<br />
Other Regions<br />
Trading transactions climbed ¥155.1 billion, or 18.8%, to ¥980.5<br />
billion, boosted mainly by higher Energy and Plant & Ship-related<br />
transactions. Operating profit soared ¥5.1 billion, or 103.2%, to<br />
¥10.0 billion, mainly because of higher earnings from Plant &<br />
Ship transactions.<br />
Please note that figures for trading transactions and operating<br />
profit have been prepared according to accounting principles<br />
generally accepted in Japan.<br />
(5) Business Results from Principal Consolidated<br />
Subsidiaries and Affiliates<br />
In terms of the operating results of consolidated subsidiaries in<br />
the fiscal year ended March 31, 2005, out of 369 consolidated<br />
subsidiaries (131 domestic, 238 overseas) and 156 affiliates (47<br />
domestic, 109 overseas), 422 companies were profitable. The<br />
percentage of companies achieving profitability was 80.4%, an<br />
improvement of 2.7 percentage points compared to 77.7% in the<br />
previous fiscal year, and exceeded 80% for the first time in four<br />
fiscal years.<br />
The 422 profitable companies generated a total profit of ¥92.7<br />
billion, ¥28.9 billion more than the ¥63.8 billion in profit posted a<br />
year earlier. In contrast, the 103 unprofitable companies generated<br />
a total loss of ¥51.0 billion, up ¥7.6 billion from the loss of ¥43.4<br />
billion recorded a year ago. The end-result was a net profit of<br />
¥41.7 billion, more than double the ¥20.4 billion in net profit<br />
posted in the previous fiscal year.<br />
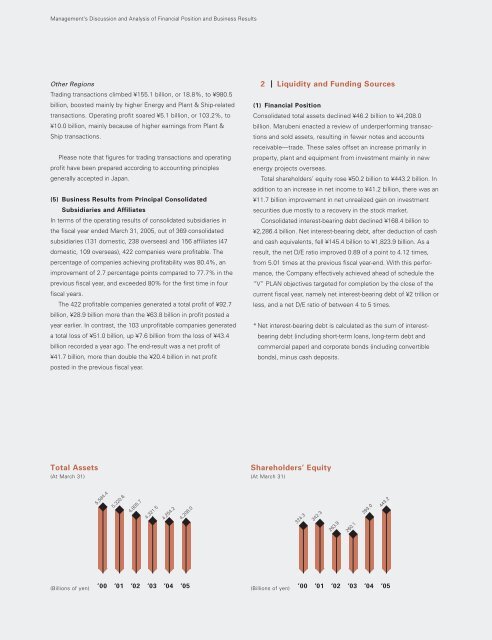
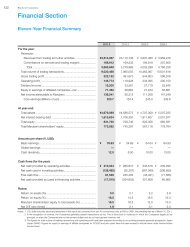
Total Assets<br />
(At March 31)<br />
5,584.4<br />
5,320.6<br />
4,805.7<br />
4,321.5<br />
4,254.2<br />
4,208.0<br />
2 Liquidity and Funding Sources<br />
(1) Financial Position<br />
Consolidated total assets declined ¥46.2 billion to ¥4,208.0<br />
billion. <strong>Marubeni</strong> enacted a review of underperforming transactions<br />
and sold assets, resulting in fewer notes and accounts<br />
receivable—trade. These sales offset an increase primarily in<br />
property, plant and equipment from investment mainly in new<br />
energy projects overseas.<br />
Total shareholders’ equity rose ¥50.2 billion to ¥443.2 billion. In<br />
addition to an increase in net income to ¥41.2 billion, there was an<br />
¥11.7 billion improvement in net unrealized gain on investment<br />
securities due mostly to a recovery in the stock market.<br />
Consolidated interest-bearing debt declined ¥168.4 billion to<br />
¥2,286.4 billion. Net interest-bearing debt, after deduction of cash<br />
and cash equivalents, fell ¥145.4 billion to ¥1,823.9 billion. As a<br />
result, the net D/E ratio improved 0.89 of a point to 4.12 times,<br />
from 5.01 times at the previous fiscal year-end. With this performance,<br />
the Company effectively achieved ahead of schedule the<br />
“V” PLAN objectives targeted for completion by the close of the<br />
current fiscal year, namely net interest-bearing debt of ¥2 trillion or<br />
less, and a net D/E ratio of between 4 to 5 times.<br />
* Net interest-bearing debt is calculated as the sum of interestbearing<br />
debt (including short-term loans, long-term debt and<br />
commercial paper) and corporate bonds (including convertible<br />
bonds), minus cash deposits.<br />
Shareholders’ Equity<br />
(At March 31)<br />
(Billions of yen) ’00 ’01 ’02 ’03 ’04 ’05<br />
(Billions of yen) ’00 ’01 ’02 ’03 ’04 ’05<br />
324.3<br />
342.3<br />
263.9<br />
260.1<br />
393.0<br />
443.2


![[Chapter 2] Driving Growth: Expansion Under SG-12 - Marubeni](https://img.yumpu.com/4161147/1/190x248/chapter-2-driving-growth-expansion-under-sg-12-marubeni.jpg?quality=85)

![[Chapter 4] Delivering Growth - Marubeni](https://img.yumpu.com/3464783/1/190x248/chapter-4-delivering-growth-marubeni.jpg?quality=85)