Trust Recovery Growth Vitalization - Marubeni
Trust Recovery Growth Vitalization - Marubeni
Trust Recovery Growth Vitalization - Marubeni

Create successful ePaper yourself
Turn your PDF publications into a flip-book with our unique Google optimized e-Paper software.
Management’s Discussion and Analysis of Financial Position and Business Results<br />
billion, or 36.7%, to ¥42.1 billion, mostly the result of higher<br />
earnings from projects in which <strong>Marubeni</strong> holds an equity interest.<br />
Metals & Mineral Resources transactions, buoyed by higher<br />
prices for coal, raw materials for steel making, and non-ferrous<br />
metals, climbed ¥116.1 billion, or 23.5%, to ¥609.3 billion.<br />
Reflecting this growth, gross trading profit climbed ¥3.5 billion, or<br />
29.2%, to ¥15.7 billion.<br />
Transportation & Industrial Machinery transactions edged ¥5.0<br />
billion, or 0.6%, lower to ¥777.6 billion. This decrease stemmed<br />
from a decline in aircraft and defense-related transactions, which<br />
offset increased transactions related to automobiles and construction<br />
machinery. Gross trading profit, however, rose ¥0.3 billion, or<br />
0.6%, to ¥56.1 billion, primarily due to higher profits from<br />
industrial machinery-related transactions.<br />
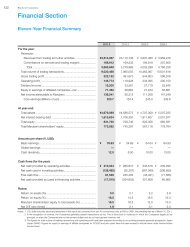
Operating Segment Information<br />
Millions of Yen Thousands of U.S. Dollars Millions of Yen<br />
Trading Transactions 2005 2005 2004 2003<br />
Agri-Marine Products ..................................... ¥ 979,855 $ 9,157,523 ¥ 856,810 ¥1,023,513<br />
Textile ............................................................ 355,311 3,320,664 352,864 370,277<br />
Forest Products & General Merchandise ....... 792,377 7,405,393 771,508 745,776<br />
Chemicals ...................................................... 667,473 6,238,065 564,526 569,928<br />
Energy ............................................................ 1,773,951 16,578,981 1,995,014 2,309,753<br />
Metals & Mineral Resources ......................... 609,2744 5,694,150 493,206 442,344<br />
Transportation & Industrial Machinery ........... 777,592 7,267,215 782,603 776,578<br />
Utility & Infrastructure .................................... 379,343 3,545,262 361,018 421,850<br />
Plant & Ship ................................................... 489,437 4,574,178 613,097 736,476<br />
Development & Construction ........................ 196,844 1,839,664 178,748 185,840<br />
Finance & Logistics Business ........................ 21,313 199,187 17,891 37,834<br />
Telecom & Information (IT Business) ............. 175,848 1,643,439 167,762 386,162<br />
Domestic Branches and Offices .................... 141,992 1,327,028 159,246 172,935<br />
Overseas Corporate Subsidiaries and Branches ... 1,070,212 10,001,981 1,035,614 1,065,367<br />
Corporate and Elimination .............................. (491,385) (4,592,384) (444,267) (451,330)<br />
Consolidated .................................................. ¥7,939,437 $74,200,346 ¥7,905,640 ¥8,793,303<br />
Millions of Yen Thousands of U.S. Dollars Millions of Yen<br />
Gross Trading Profit 2005 2005 2004 2003<br />
Agri-Marine Products ..................................... ¥ 71,312 $ 666,467 ¥ 61,436 ¥ 58,559<br />
Textile ............................................................ 25,174 235,271 23,914 24,494<br />
Forest Products & General Merchandise ....... 46,612 435,626 42,009 41,242<br />
Chemicals ...................................................... 26,857 251,000 24,945 29,279<br />
Energy ............................................................ 42,132 393,757 30,817 29,615<br />
Metals & Mineral Resources ......................... 15,709 146,813 12,163 13,984<br />
Transportation & Industrial Machinery ........... 56,098 524,280 55,769 54,371<br />
Utility & Infrastructure .................................... 22,646 211,645 20,567 11,832<br />
Plant & Ship ................................................... 13,332 124,598 8,836 13,866<br />
Development & Construction ........................ 27,530 257,290 27,909 34,027<br />
Finance & Logistics Business ........................ 5,785 54,065 4,900 6,523<br />
Telecom & Information (IT Business) ............. 24,483 228,813 19,952 32,559<br />
Domestic Branches and Offices .................... 4,898 45,776 5,427 6,081<br />
Overseas Corporate Subsidiaries and Branches ... 76,517 715,112 73,458 72,827<br />
Corporate and Elimination .............................. (23,030) (215,233) (2,641) (4,616)<br />
Consolidated .................................................. ¥436,055 $4,075,280 ¥409,461 ¥424,643<br />
Note: Trading transactions have been prepared according to accounting principles generally accepted in Japan.<br />
Utility & Infrastructure transactions were up ¥18.3 billion, or<br />
5.1%, to ¥379.3 billion due largely to an increase in overseas IPP<br />
business operating companies. Gross trading profit rose ¥2.1<br />
billion, or 10.1%, to ¥22.6 billion due to the growth in transactions.<br />
Plant & Ship transactions declined ¥123.7 billion, or 20.2%, to<br />
¥489.4 billion mainly because of fewer energy and chemical plant<br />
transactions. Despite an initial drop reflecting this decline, gross<br />
trading profit soared ¥4.5 billion, or 50.9%, to ¥13.3 billion, largely<br />
from the consolidation of shipping-related operating companies.<br />
In April 2005, <strong>Marubeni</strong> subsidiary Japan Indonesia Petrochemical<br />
Investment Corporation sold financial assets related to its<br />
Chandra Asri petrochemical operations to Commerzbank<br />
International <strong>Trust</strong> (Singapore) Ltd. In exchange, a basic
![[Chapter 2] Driving Growth: Expansion Under SG-12 - Marubeni](https://img.yumpu.com/4161147/1/190x248/chapter-2-driving-growth-expansion-under-sg-12-marubeni.jpg?quality=85)
![[Chapter 4] Delivering Growth - Marubeni](https://img.yumpu.com/3464783/1/190x248/chapter-4-delivering-growth-marubeni.jpg?quality=85)