Trust Recovery Growth Vitalization - Marubeni
Trust Recovery Growth Vitalization - Marubeni
Trust Recovery Growth Vitalization - Marubeni

You also want an ePaper? Increase the reach of your titles
YUMPU automatically turns print PDFs into web optimized ePapers that Google loves.
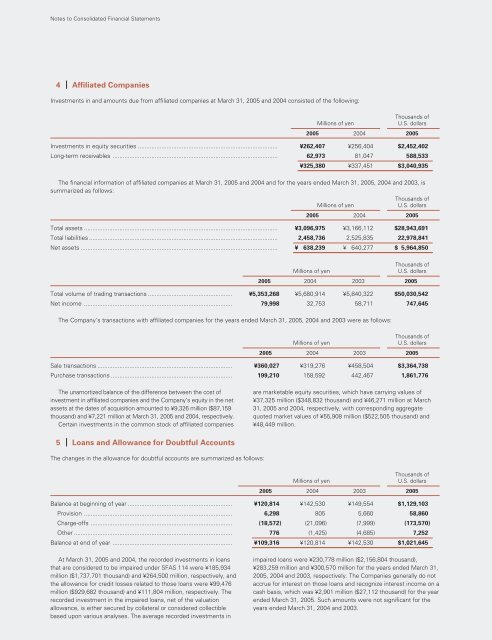
Notes to Consolidated Financial Statements<br />
4 Affiliated Companies<br />
Investments in and amounts due from affiliated companies at March 31, 2005 and 2004 consisted of the following:<br />
Thousands of<br />
Millions of yen U.S. dollars<br />
2005 2004 2005<br />
Investments in equity securities ................................................................................... ¥262,407 ¥256,404 $2,452,402<br />
Long-term receivables .................................................................................................. 62,973 81,047 588,533<br />
¥325,380 ¥337,451 $3,040,935<br />
The financial information of affiliated companies at March 31, 2005 and 2004 and for the years ended March 31, 2005, 2004 and 2003, is<br />
summarized as follows:<br />
Thousands of<br />
Millions of yen U.S. dollars<br />
2005 2004 2005<br />
Total assets ................................................................................................................... ¥3,096,975 ¥3,166,112 $28,943,691<br />
Total liabilities ................................................................................................................ 2,458,736 2,525,835 22,978,841<br />
Net assets ..................................................................................................................... ¥ 638,239 ¥ 640,277 $ 5,964,850<br />
Thousands of<br />
Millions of yen U.S. dollars<br />
2005 2004 2003 2005<br />
Total volume of trading transactions .................................................. ¥5,353,268 ¥5,680,914 ¥5,840,322 $50,030,542<br />
Net income ........................................................................................ 79,998 32,753 58,711 747,645<br />
The Company’s transactions with affiliated companies for the years ended March 31, 2005, 2004 and 2003 were as follows:<br />
Millions of yen<br />
Thousands of<br />
U.S. dollars<br />
2005 2004 2003 2005<br />
Sale transactions ................................................................................ ¥360,027 ¥319,276 ¥458,504 $3,364,738<br />
Purchase transactions ........................................................................ 199,210 158,592 442,467 1,861,776<br />
The unamortized balance of the difference between the cost of<br />
investment in affiliated companies and the Company’s equity in the net<br />
assets at the dates of acquisition amounted to ¥9,326 million ($87,159<br />
thousand) and ¥7,221 million at March 31, 2005 and 2004, respectively.<br />
Certain investments in the common stock of affiliated companies<br />
5 Loans and Allowance for Doubtful Accounts<br />
The changes in the allowance for doubtful accounts are summarized as follows:<br />
are marketable equity securities, which have carrying values of<br />
¥37,325 million ($348,832 thousand) and ¥46,271 million at March<br />
31, 2005 and 2004, respectively, with corresponding aggregate<br />
quoted market values of ¥55,908 million ($522,505 thousand) and<br />
¥48,449 million.<br />
Millions of yen<br />
Thousands of<br />
U.S. dollars<br />
2005 2004 2003 2005<br />
Balance at beginning of year .............................................................. ¥120,814 ¥142,530 ¥149,554 $1,129,103<br />
Provision ........................................................................................ 6,298 805 5,660 58,860<br />
Charge-offs .................................................................................... (18,572) (21,096) (7,999) (173,570)<br />
Other .............................................................................................. 776 (1,425) (4,685) 7,252<br />
Balance at end of year ....................................................................... ¥109,316 ¥120,814 ¥142,530 $1,021,645<br />
At March 31, 2005 and 2004, the recorded investments in loans<br />
that are considered to be impaired under SFAS 114 were ¥185,934<br />
million ($1,737,701 thousand) and ¥264,500 million, respectively, and<br />
the allowance for credit losses related to those loans were ¥99,476<br />
million ($929,682 thousand) and ¥111,804 million, respectively. The<br />
recorded investment in the impaired loans, net of the valuation<br />
allowance, is either secured by collateral or considered collectible<br />
based upon various analyses. The average recorded investments in<br />
impaired loans were ¥230,778 million ($2,156,804 thousand),<br />
¥283,259 million and ¥300,570 million for the years ended March 31,<br />
2005, 2004 and 2003, respectively. The Companies generally do not<br />
accrue for interest on those loans and recognize interest income on a<br />
cash basis, which was ¥2,901 million ($27,112 thousand) for the year<br />
ended March 31, 2005. Such amounts were not significant for the<br />
years ended March 31, 2004 and 2003.
![[Chapter 2] Driving Growth: Expansion Under SG-12 - Marubeni](https://img.yumpu.com/4161147/1/190x248/chapter-2-driving-growth-expansion-under-sg-12-marubeni.jpg?quality=85)
![[Chapter 4] Delivering Growth - Marubeni](https://img.yumpu.com/3464783/1/190x248/chapter-4-delivering-growth-marubeni.jpg?quality=85)