Annual Report and Accounts - Hemscott IR
Annual Report and Accounts - Hemscott IR
Annual Report and Accounts - Hemscott IR

Create successful ePaper yourself
Turn your PDF publications into a flip-book with our unique Google optimized e-Paper software.
TRAVIS PERKINS ANNUAL REPORT AND ACCOUNTS 2012<br />
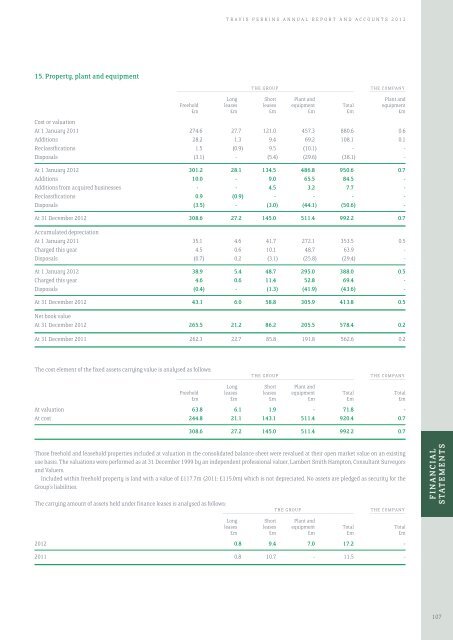
15. Property, plant <strong>and</strong> equipment<br />
THE GROUP<br />
THE COMPANY<br />
–––––––––––––––––––––––––––––––––––––––––––––––––––––––––––––––––––––––––––––––––––––––––––––––––––––––––––––––––––– ––-–––––––––––––––––––––<br />
Long Short Plant <strong>and</strong> Plant <strong>and</strong><br />
Freehold leases leases equipment Total equipment<br />
£m £m £m £m £m £m<br />
Cost or valuation<br />
At 1 January 2011 274.6 27.7 121.0 457.3 880.6 0.6<br />
Additions 28.2 1.3 9.4 69.2 108.1 0.1<br />
Reclassifications 1.5 (0.9) 9.5 (10.1) - -<br />
Disposals (3.1) - (5.4) (29.6) (38.1) -<br />
At 1 January 2012 301.2 28.1 134.5 486.8 950.6 0.7<br />
Additions 10.0 - 9.0 65.5 84.5 -<br />
Additions from acquired businesses - - 4.5 3.2 7.7 -<br />
Reclassifications 0.9 (0.9) - - - -<br />
Disposals (3.5) - (3.0) (44.1) (50.6) -<br />
At 31 December 2012 308.6 27.2 145.0 511.4 992.2 0.7<br />
Accumulated depreciation<br />
At 1 January 2011 35.1 4.6 41.7 272.1 353.5 0.5<br />
Charged this year 4.5 0.6 10.1 48.7 63.9 -<br />
Disposals (0.7) 0.2 (3.1) (25.8) (29.4) -<br />
At 1 January 2012 38.9 5.4 48.7 295.0 388.0 0.5<br />
Charged this year 4.6 0.6 11.4 52.8 69.4 -<br />
Disposals (0.4) - (1.3) (41.9) (43.6) -<br />
At 31 December 2012 43.1 6.0 58.8 305.9 413.8 0.5<br />
Net book value<br />
At 31 December 2012 265.5 21.2 86.2 205.5 578.4 0.2<br />
At 31 December 2011 262.3 22.7 85.8 191.8 562.6 0.2<br />
The cost element of the fixed assets carrying value is analysed as follows:<br />
THE GROUP<br />
THE COMPANY<br />
–––––––––––––––––––––––––––––––––––––––––––––––––––––––––––––––––––––––––––––––––––––––––––––––––––––––––––––––––––– ––-–––––––––––––––––––––<br />
Long Short Plant <strong>and</strong><br />
Freehold leases leases equipment Total Total<br />
£m £m £m £m £m £m<br />
At valuation 63.8 6.1 1.9 - 71.8 -<br />
At cost 244.8 21.1 143.1 511.4 920.4 0.7<br />
308.6 27.2 145.0 511.4 992.2 0.7<br />
Those freehold <strong>and</strong> leasehold properties included at valuation in the consolidated balance sheet were revalued at their open market value on an existing<br />
use basis. The valuations were performed as at 31 December 1999 by an independent professional valuer, Lambert Smith Hampton, Consultant Surveyors<br />
<strong>and</strong> Valuers.<br />
Included within freehold property is l<strong>and</strong> with a value of £117.7m (2011: £115.0m) which is not depreciated. No assets are pledged as security for the<br />
Group’s liabilities.<br />
The carrying amount of assets held under finance leases is analysed as follows:<br />
THE GROUP<br />
THE COMPANY<br />
–––––––––––––––––––––––––––––––––––––––––––––––––––––––––––––––––––––––––––––––––––––– ––-–––––––––––––––––––––<br />
Long Short Plant <strong>and</strong><br />
leases leases equipment Total Total<br />
£m £m £m £m £m<br />
2012 0.8 9.4 7.0 17.2 -<br />
FINANCIAL<br />
STATEMENTS<br />
2011 0.8 10.7 - 11.5 -<br />
107