Annual Report and Accounts - Hemscott IR
Annual Report and Accounts - Hemscott IR
Annual Report and Accounts - Hemscott IR

Create successful ePaper yourself
Turn your PDF publications into a flip-book with our unique Google optimized e-Paper software.
NOTES TO THE FINANCIAL STATEMENTS<br />
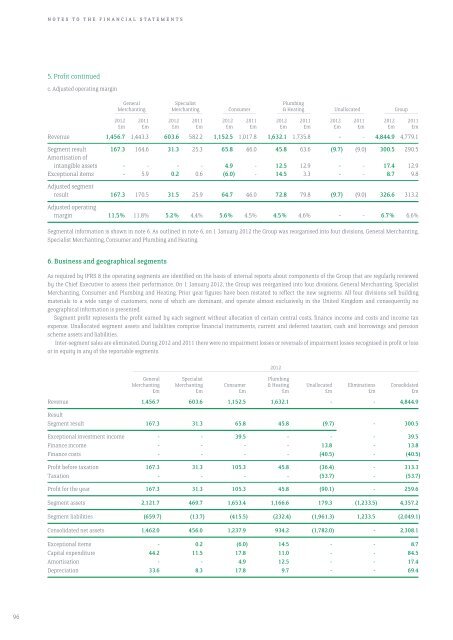
5. Profit continued<br />
c. Adjusted operating margin<br />
General Specialist Plumbing<br />
merchanting Merchanting Consumer & Heating Unallocated Group<br />
–––––––––––––––––––––– –––––––––––––––––––––– –––––––––––––––––––––– –––––––––––––––––––––– –––––––––––––––––––––– ––––––––––––––––––––––<br />
2012 2011 2012 2011 2012 2011 2012 2011 2012 2011 2012 2011<br />
£m £m £m £m £m £m £m £m £m £m £m £m<br />
Revenue 1,456.7 1,443.3 603.6 582.2 1,152.5 1,017.8 1,632.1 1,735.8 - - 4,844.9 4,779.1<br />
Segment result 167.3 164.6 31.3 25.3 65.8 46.0 45.8 63.6 (9.7) (9.0) 300.5 290.5<br />
Amortisation of<br />
intangible assets - - - - 4.9 - 12.5 12.9 - - 17.4 12.9<br />
Exceptional items - 5.9 0.2 0.6 (6.0) - 14.5 3.3 - - 8.7 9.8<br />
Adjusted segment<br />
result 167.3 170.5 31.5 25.9 64.7 46.0 72.8 79.8 (9.7) (9.0) 326.6 313.2<br />
Adjusted operating<br />
margin 11.5% 11.8% 5.2% 4.4% 5.6% 4.5% 4.5% 4.6% - - 6.7% 6.6%<br />
Segmental information is shown in note 6. As outlined in note 6, on 1 January 2012 the Group was reorganised into four divisions, General Merchanting,<br />
Specialist Merchanting, Consumer <strong>and</strong> Plumbing <strong>and</strong> Heating.<br />
6. Business <strong>and</strong> geographical segments<br />
As required by IFRS 8 the operating segments are identified on the basis of internal reports about components of the Group that are regularly reviewed<br />
by the Chief Executive to assess their performance. On 1 January 2012, the Group was reorganised into four divisions, General Merchanting, Specialist<br />
Merchanting, Consumer <strong>and</strong> Plumbing <strong>and</strong> Heating. Prior year figures have been restated to reflect the new segments. All four divisions sell building<br />
materials to a wide range of customers, none of which are dominant, <strong>and</strong> operate almost exclusively in the United Kingdom <strong>and</strong> consequently no<br />
geographical information is presented.<br />
Segment profit represents the profit earned by each segment without allocation of certain central costs, finance income <strong>and</strong> costs <strong>and</strong> income tax<br />
expense. Unallocated segment assets <strong>and</strong> liabilities comprise financial instruments, current <strong>and</strong> deferred taxation, cash <strong>and</strong> borrowings <strong>and</strong> pension<br />
scheme assets <strong>and</strong> liabilities.<br />
Inter-segment sales are eliminated. During 2012 <strong>and</strong> 2011 there were no impairment losses or reversals of impairment losses recognised in profit or loss<br />
or in equity in any of the reportable segments.<br />
2012<br />
––––––––––––––––––––––––––––––––––––––––––––––––––––––––––––––––––––––––––––––––––––––––––––––––––––––––––––––––––––––––––––––––––––––––––––––––––––––––––––––––––––––––––––––––––––––––––––<br />
General Specialist Plumbing<br />
M merchanting Merchanting Consumer & Heating Unallocated Eliminations Consolidated<br />
£m £m £m £m £m £m £m<br />
Revenue 1,456.7 603.6 1,152.5 1,632.1 - - 4,844.9<br />
Result<br />
Segment result 167.3 31.3 65.8 45.8 (9.7) - 300.5<br />
Exceptional investment income - - 39.5 - - - 39.5<br />
Finance income - - - - 13.8 - 13.8<br />
Finance costs - - - - (40.5) - (40.5)<br />
Profit before taxation 167.3 31.3 105.3 45.8 (36.4) - 313.3<br />
Taxation - - - - (53.7) - (53.7)<br />
Profit for the year 167.3 31.3 105.3 45.8 (90.1) - 259.6<br />
Segment assets 2,121.7 469.7 1,653.4 1,166.6 179.3 (1,233.5) 4,357.2<br />
Segment liabilities (659.7) (13.7) (415.5) (232.4) (1,961.3) 1,233.5 (2,049.1)<br />
Consolidated net assets 1,462.0 456.0 1,237.9 934.2 (1,782.0) - 2,308.1<br />
Exceptional items - 0.2 (6.0) 14.5 - - 8.7<br />
Capital expenditure 44.2 11.5 17.8 11.0 - - 84.5<br />
Amortisation - - 4.9 12.5 - - 17.4<br />
Depreciation 33.6 8.3 17.8 9.7 - - 69.4<br />
96