Annual Report and Accounts - Hemscott IR
Annual Report and Accounts - Hemscott IR
Annual Report and Accounts - Hemscott IR

Create successful ePaper yourself
Turn your PDF publications into a flip-book with our unique Google optimized e-Paper software.
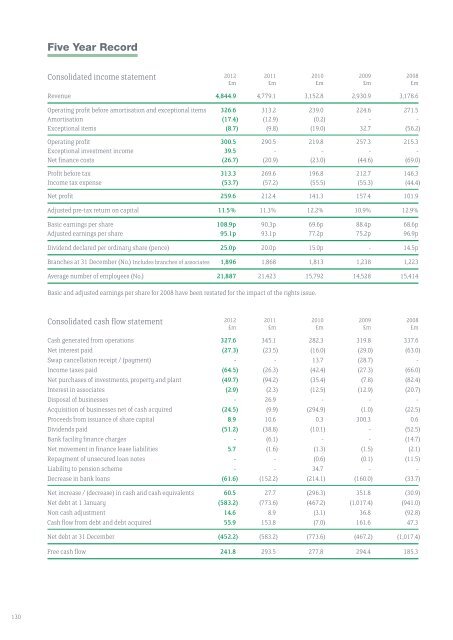
Five Year Record<br />
Consolidated income statement<br />
2012 2011 2010 2009 2008<br />
£m £m £m £m £m<br />
Revenue 4,844.9 4,779.1 3,152.8 2,930.9 3,178.6<br />
Operating profit before amortisation <strong>and</strong> exceptional items 326.6 313.2 239.0 224.6 271.5<br />
Amortisation (17.4) (12.9) (0.2) - -<br />
Exceptional items (8.7) (9.8) (19.0) 32.7 (56.2)<br />
Operating profit 300.5 290.5 219.8 257.3 215.3<br />
Exceptional investment income 39.5 - - - -<br />
Net finance costs (26.7) (20.9) (23.0) (44.6) (69.0)<br />
Profit before tax 313.3 269.6 196.8 212.7 146.3<br />
Income tax expense (53.7) (57.2) (55.5) (55.3) (44.4)<br />
Net profit 259.6 212.4 141.3 157.4 101.9<br />
Adjusted pre-tax return on capital 11.5% 11.3% 12.2% 10.9% 12.9%<br />
Basic earnings per share 108.9p 90.3p 69.6p 88.4p 68.6p<br />
Adjusted earnings per share 95.1p 93.1p 77.2p 75.2p 96.9p<br />
Dividend declared per ordinary share (pence) 25.0p 20.0p 15.0p - 14.5p<br />
Branches at 31 December (No.) Includes branches of associates 1,896 1,868 1,813 1,238 1,223<br />
Average number of employees (No.) 21,887 21,423 15,792 14,528 15,414<br />
Basic <strong>and</strong> adjusted earnings per share for 2008 have been restated for the impact of the rights issue.<br />
Consolidated cash flow statement<br />
2012 2011 2010 2009 2008<br />
£m £m £m £m £m<br />
Cash generated from operations 327.6 345.1 282.3 319.8 337.6<br />
Net interest paid (27.3) (23.5) (16.0) (29.0) (63.0)<br />
Swap cancellation receipt / (payment) - - 13.7 (28.7) -<br />
Income taxes paid (64.5) (26.3) (42.4) (27.3) (66.0)<br />
Net purchases of investments, property <strong>and</strong> plant (49.7) (94.2) (35.4) (7.8) (82.4)<br />
Interest in associates (2.9) (2.3) (12.5) (12.9) (20.7)<br />
Disposal of businesses - 26.9 - - -<br />
Acquisition of businesses net of cash acquired (24.5) (9.9) (294.9) (1.0) (22.5)<br />
Proceeds from issuance of share capital 8.9 10.6 0.3 300.3 0.6<br />
Dividends paid (51.2) (38.8) (10.1) - (52.5)<br />
Bank facility finance charges - (6.1) - - (14.7)<br />
Net movement in finance lease liabilities 5.7 (1.6) (1.3) (1.5) (2.1)<br />
Repayment of unsecured loan notes - - (0.6) (0.1) (11.5)<br />
Liability to pension scheme - - 34.7 - -<br />
Decrease in bank loans (61.6) (152.2) (214.1) (160.0) (33.7)<br />
Net increase / (decrease) in cash <strong>and</strong> cash equivalents 60.5 27.7 (296.3) 351.8 (30.9)<br />
Net debt at 1 January (583.2) (773.6) (467.2) (1,017.4) (941.0)<br />
Non cash adjustment 14.6 8.9 (3.1) 36.8 (92.8)<br />
Cash flow from debt <strong>and</strong> debt acquired 55.9 153.8 (7.0) 161.6 47.3<br />
Net debt at 31 December (452.2) (583.2) (773.6) (467.2) (1,017.4)<br />
Free cash flow 241.8 293.5 277.8 294.4 185.3<br />
130