Annual Report and Accounts - Hemscott IR
Annual Report and Accounts - Hemscott IR
Annual Report and Accounts - Hemscott IR

Create successful ePaper yourself
Turn your PDF publications into a flip-book with our unique Google optimized e-Paper software.
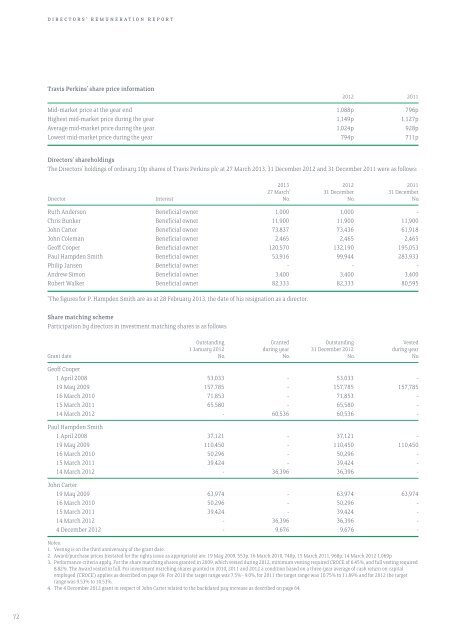
Directors’ Remuneration <strong>Report</strong><br />
Travis Perkins’ share price information<br />
2012 2011<br />
Mid-market price at the year end 1,088p 796p<br />
Highest mid-market price during the year 1,149p 1,127p<br />
Average mid-market price during the year 1,024p 928p<br />
Lowest mid-market price during the year 794p 711p<br />
Directors’ shareholdings<br />
The Directors’ holdings of ordinary 10p shares of Travis Perkins plc at 27 March 2013, 31 December 2012 <strong>and</strong> 31 December 2011 were as follows:<br />
2013 2012 2011<br />
27 March * 31 December 31 December<br />
Director Interest No. No. No.<br />
Ruth Anderson beneficial owner 1,000 1,000 -<br />
Chris Bunker beneficial owner 11,900 11,900 11,900<br />
John Carter beneficial owner 73,837 73,436 61,918<br />
John Coleman beneficial owner 2,465 2,465 2,465<br />
Geoff Cooper beneficial owner 120,570 132,190 195,053<br />
Paul Hampden Smith beneficial owner 53,916 99,944 283,933<br />
Philip Jansen beneficial owner - - -<br />
Andrew Simon beneficial owner 3,400 3,400 3,400<br />
Robert Walker beneficial owner 82,333 82,333 80,595<br />
*<br />
The figures for P. Hampden Smith are as at 28 February 2013, the date of his resignation as a director.<br />
Share matching scheme<br />
Participation by directors in investment matching shares is as follows:<br />
Outst<strong>and</strong>ing Granted Outst<strong>and</strong>ing Vested<br />
1 January 2012 during year 31 December 2012 during year<br />
Grant date No. No. No. No.<br />
Geoff Cooper<br />
1 April 2008 53,033 - 53,033 -<br />
19 May 2009 157,785 - 157,785 157,785<br />
16 March 2010 71,853 - 71,853 -<br />
15 March 2011 65,580 - 65,580 -<br />
14 March 2012 - 60,536 60,536 -<br />
Paul Hampden Smith<br />
1 April 2008 37,121 - 37,121 -<br />
19 May 2009 110,450 - 110,450 110,450<br />
16 March 2010 50,296 - 50,296 -<br />
15 March 2011 39,424 - 39,424 -<br />
14 March 2012 - 36,396 36,396 -<br />
John Carter<br />
19 May 2009 63,974 - 63,974 63,974<br />
16 March 2010 50,296 - 50,296 -<br />
15 March 2011 39,424 - 39,424 -<br />
14 March 2012 - 36,396 36,396 -<br />
4 December 2012 - 9,676 9,676 -<br />
Notes:<br />
1. Vesting is on the third anniversary of the grant date.<br />
2. Award/purchase prices (restated for the rights issue as appropriate) are: 19 May 2009, 553p, 16 March 2010, 740p, 15 March 2011, 968p, 14 March 2012 1,069p<br />
3. Performance criteria apply. For the share matching shares granted in 2009, which vested during 2012, minimum vesting required CROCE of 6.45%, <strong>and</strong> full vesting required<br />
8.82%. The Award vested in full. For investment matching shares granted in 2010, 2011 <strong>and</strong> 2012 a condition based on a three-year average of cash return on capital<br />
employed (‘CROCE’) applies as described on page 69. For 2010 the target range was 7.5% - 9.0%, for 2011 the target range was 10.75% to 11.89% <strong>and</strong> for 2012 the target<br />
range was 9.53% to 10.53%.<br />
4. The 4 December 2012 grant in respect of John Carter related to the backdated pay increase as described on page 64.<br />
72