Annual Report and Accounts - Hemscott IR
Annual Report and Accounts - Hemscott IR
Annual Report and Accounts - Hemscott IR

Create successful ePaper yourself
Turn your PDF publications into a flip-book with our unique Google optimized e-Paper software.
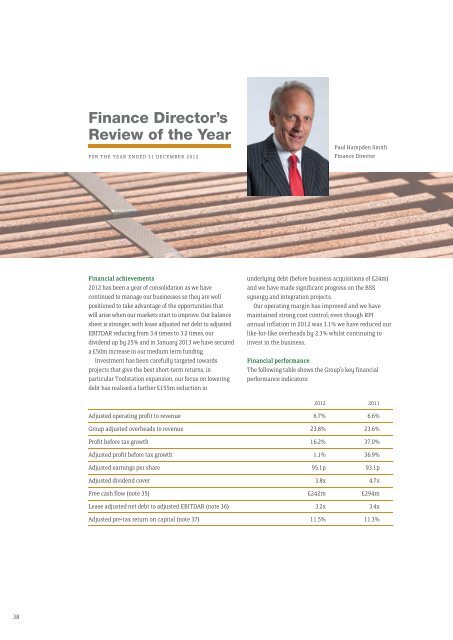
Finance Director’s<br />
Review of the Year<br />
FOR THE YEAR ENDED 31 DECEMBER 2012<br />
Paul Hampden Smith<br />
Finance Director<br />
Financial achievements<br />
2012 has been a year of consolidation as we have<br />
continued to manage our businesses so they are well<br />
positioned to take advantage of the opportunities that<br />
will arise when our markets start to improve. Our balance<br />
sheet is stronger, with lease adjusted net debt to adjusted<br />
EBITDAR reducing from 3.4 times to 3.2 times, our<br />
dividend up by 25% <strong>and</strong> in January 2013 we have secured<br />
a £50m increase in our medium term funding.<br />
Investment has been carefully targeted towards<br />
projects that give the best short-term returns, in<br />
particular Toolstation expansion, our focus on lowering<br />
debt has realised a further £155m reduction in<br />
underlying debt (before business acquisitions of £24m)<br />
<strong>and</strong> we have made significant progress on the BSS<br />
synergy <strong>and</strong> integration projects.<br />
Our operating margin has improved <strong>and</strong> we have<br />
maintained strong cost control; even though RPI<br />
annual inflation in 2012 was 3.1% we have reduced our<br />
like-for-like overheads by 2.3% whilst continuing to<br />
invest in the business.<br />
Financial performance<br />
The following table shows the Group’s key financial<br />
performance indicators:<br />
2012 2011<br />
Adjusted operating profit to revenue 6.7% 6.6%<br />
Group adjusted overheads to revenue 23.8% 23.6%<br />
Profit before tax growth 16.2% 37.0%<br />
Adjusted profit before tax growth 1.1% 36.9%<br />
Adjusted earnings per share 95.1p 93.1p<br />
Adjusted dividend cover 3.8x 4.7x<br />
Free cash flow (note 35) £242m £294m<br />
Lease adjusted net debt to adjusted EBITDAR (note 36) 3.2x 3.4x<br />
Adjusted pre-tax return on capital (note 37) 11.5% 11.3%<br />
38