Annual Report and Accounts - Hemscott IR
Annual Report and Accounts - Hemscott IR
Annual Report and Accounts - Hemscott IR

You also want an ePaper? Increase the reach of your titles
YUMPU automatically turns print PDFs into web optimized ePapers that Google loves.
TRAVIS PERKINS ANNUAL REPORT AND ACCOUNTS 2012<br />
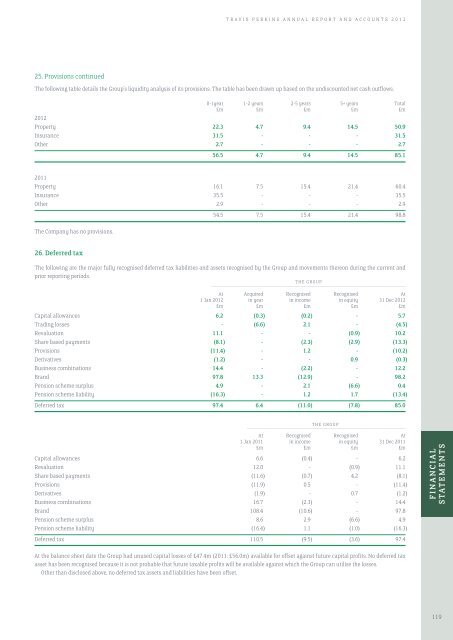
25. Provisions continued<br />
The following table details the Group’s liquidity analysis of its provisions. The table has been drawn up based on the undiscounted net cash outflows.<br />
0-1year 1-2 years 2-5 years 5+ years Total<br />
£m £m £m £m £m<br />
2012<br />
Property 22.3 4.7 9.4 14.5 50.9<br />
Insurance 31.5 - - - 31.5<br />
Other 2.7 - - - 2.7<br />
56.5 4.7 9.4 14.5 85.1<br />
2011<br />
Property 16.1 7.5 15.4 21.4 60.4<br />
Insurance 35.5 - - - 35.5<br />
Other 2.9 - - - 2.9<br />
The Company has no provisions.<br />
54.5 7.5 15.4 21.4 98.8<br />
26. Deferred tax<br />
The following are the major fully recognised deferred tax liabilities <strong>and</strong> assets recognised by the Group <strong>and</strong> movements thereon during the current <strong>and</strong><br />
prior reporting periods.<br />
THE GROUP<br />
––––––––––––––––––––––––––––––––––––––––––––––––––––––––––––––––––––––––––––––––––––––––––––––––––––––––––––––––––––––––––––––––<br />
At Acquired Recognised Recognised At<br />
1 Jan 2012 in year in income in equity 31 Dec 2012<br />
£m £m £m £m £m<br />
Capital allowances 6.2 (0.3) (0.2) - 5.7<br />
Trading losses - (6.6) 2.1 - (4.5)<br />
Revaluation 11.1 - - (0.9) 10.2<br />
Share based payments (8.1) - (2.3) (2.9) (13.3)<br />
Provisions (11.4) - 1.2 - (10.2)<br />
Derivatives (1.2) - - 0.9 (0.3)<br />
Business combinations 14.4 - (2.2) - 12.2<br />
Br<strong>and</strong> 97.8 13.3 (12.9) - 98.2<br />
Pension scheme surplus 4.9 - 2.1 (6.6) 0.4<br />
Pension scheme liability (16.3) - 1.2 1.7 (13.4)<br />
Deferred tax 97.4 6.4 (11.0) (7.8) 85.0<br />
THE GROUP<br />
––––––––––––––––––––––––––––––––––––––––––––––––––––––––––––––––––––––––––––––––––––––––––––––––––––––––<br />
At Recognised Recognised At<br />
1 Jan 2011 in income in equity 31 Dec 2011<br />
£m £m £m £m<br />
Capital allowances 6.6 (0.4) - 6.2<br />
Revaluation 12.0 - (0.9) 11.1<br />
Share based payments (11.6) (0.7) 4.2 (8.1)<br />
Provisions (11.9) 0.5 - (11.4)<br />
Derivatives (1.9) - 0.7 (1.2)<br />
Business combinations 16.7 (2.3) - 14.4<br />
Br<strong>and</strong> 108.4 (10.6) - 97.8<br />
Pension scheme surplus 8.6 2.9 (6.6) 4.9<br />
Pension scheme liability (16.4) 1.1 (1.0) (16.3)<br />
Deferred tax 110.5 (9.5) (3.6) 97.4<br />
FINANCIAL<br />
STATEMENTS<br />
At the balance sheet date the Group had unused capital losses of £47.4m (2011: £56.0m) available for offset against future capital profits. No deferred tax<br />
asset has been recognised because it is not probable that future taxable profits will be available against which the Group can utilise the losses.<br />
Other than disclosed above, no deferred tax assets <strong>and</strong> liabilities have been offset.<br />
119