Annual Report and Accounts - Hemscott IR
Annual Report and Accounts - Hemscott IR
Annual Report and Accounts - Hemscott IR

You also want an ePaper? Increase the reach of your titles
YUMPU automatically turns print PDFs into web optimized ePapers that Google loves.
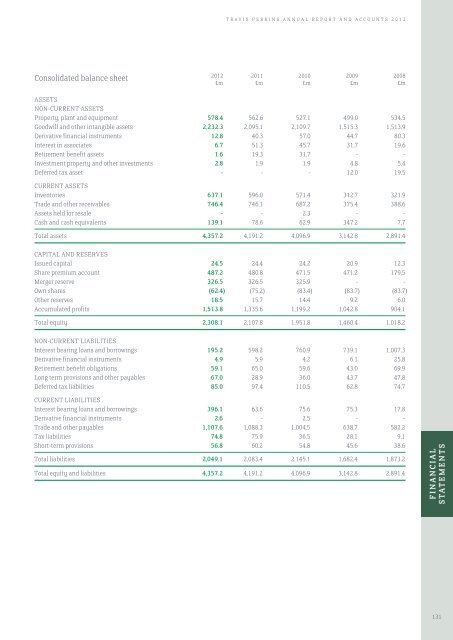
TRAVIS PERKINS ANNUAL REPORT AND ACCOUNTS 2012<br />
Consolidated balance sheet<br />
2012 2011 2010 2009 2008<br />
£m £m £m £m £m<br />
Assets<br />
Non-current assets<br />
Property, plant <strong>and</strong> equipment 578.4 562.6 527.1 499.0 534.5<br />
Goodwill <strong>and</strong> other intangible assets 2,232.3 2,095.1 2,109.7 1,515.3 1,513.9<br />
Derivative financial instruments 12.8 40.3 57.0 44.7 80.3<br />
Interest in associates 6.7 51.3 45.7 31.7 19.6<br />
Retirement benefit assets 1.6 19.3 31.7 - -<br />
Investment property <strong>and</strong> other investments 2.8 1.9 1.9 4.8 5.4<br />
Deferred tax asset - - - 12.0 19.5<br />
Current assets<br />
Inventories 637.1 596.0 571.4 312.7 321.9<br />
Trade <strong>and</strong> other receivables 746.4 746.1 687.2 375.4 388.6<br />
Assets held for resale - - 2.3 - -<br />
Cash <strong>and</strong> cash equivalents 139.1 78.6 62.9 347.2 7.7<br />
Total assets 4,357.2 4,191.2 4,096.9 3,142.8 2,891.4<br />
CAPITAL AND RESERVES<br />
Issued capital 24.5 24.4 24.2 20.9 12.3<br />
Share premium account 487.2 480.8 471.5 471.2 179.5<br />
Merger reserve 326.5 326.5 325.9 - -<br />
Own shares (62.4) (75.2) (83.4) (83.7) (83.7)<br />
Other reserves 18.5 15.7 14.4 9.2 6.0<br />
Accumulated profits 1,513.8 1,335.6 1,199.2 1,042.8 904.1<br />
Total equity 2,308.1 2,107.8 1,951.8 1,460.4 1,018.2<br />
Non-current liabilities<br />
Interest bearing loans <strong>and</strong> borrowings 195.2 598.2 760.9 739.1 1,007.3<br />
Derivative financial instruments 4.9 5.9 4.2 6.1 25.8<br />
Retirement benefit obligations 59.1 65.0 59.6 43.0 69.9<br />
Long term provisions <strong>and</strong> other payables 67.0 28.9 36.0 43.7 47.8<br />
Deferred tax liabilities 85.0 97.4 110.5 62.8 74.7<br />
Current liabilities<br />
Interest bearing loans <strong>and</strong> borrowings 396.1 63.6 75.6 75.3 17.8<br />
Derivative financial instruments 2.6 - 2.5 - -<br />
Trade <strong>and</strong> other payables 1,107.6 1,088.3 1,004.5 638.7 582.2<br />
Tax liabilities 74.8 75.9 36.5 28.1 9.1<br />
Short-term provisions 56.8 60.2 54.8 45.6 38.6<br />
Total liabilities 2,049.1 2,083.4 2,145.1 1,682.4 1,873.2<br />
Total equity <strong>and</strong> liabilities 4,357.2 4,191.2 4,096.9 3,142.8 2,891.4<br />
FINANCIAL<br />
STATEMENTS<br />
131