Annual Report and Accounts - Hemscott IR
Annual Report and Accounts - Hemscott IR
Annual Report and Accounts - Hemscott IR

Create successful ePaper yourself
Turn your PDF publications into a flip-book with our unique Google optimized e-Paper software.
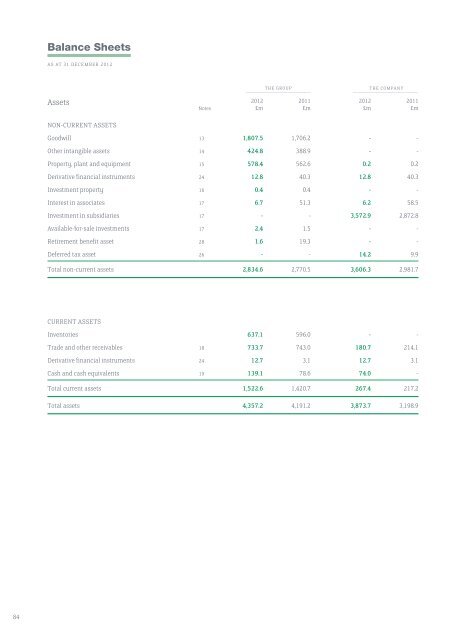
Balance Sheets<br />
As at 31 December 2012<br />
Assets<br />
The Group<br />
The Company<br />
––––––––––––––––––––––––––––– –––––––––––––––––––––––––––––<br />
2012 2011 2012 2011<br />
Notes £m £m £m £m<br />
NON-CURRENT ASSETS<br />
Goodwill 13 1,807.5 1,706.2 - -<br />
Other intangible assets 14 424.8 388.9 - -<br />
Property, plant <strong>and</strong> equipment 15 578.4 562.6 0.2 0.2<br />
Derivative financial instruments 24 12.8 40.3 12.8 40.3<br />
Investment property 16 0.4 0.4 - -<br />
Interest in associates 17 6.7 51.3 6.2 58.5<br />
Investment in subsidiaries 17 - - 3,572.9 2,872.8<br />
Available-for-sale investments 17 2.4 1.5 - -<br />
Retirement benefit asset 28 1.6 19.3 - -<br />
Deferred tax asset 26 - - 14.2 9.9<br />
Total non-current assets 2,834.6 2,770.5 3,606.3 2,981.7<br />
CURRENT ASSETS<br />
Inventories 637.1 596.0 - -<br />
Trade <strong>and</strong> other receivables 18 733.7 743.0 180.7 214.1<br />
Derivative financial instruments 24 12.7 3.1 12.7 3.1<br />
Cash <strong>and</strong> cash equivalents 19 139.1 78.6 74.0 -<br />
Total current assets 1,522.6 1,420.7 267.4 217.2<br />
Total assets 4,357.2 4,191.2 3,873.7 3,198.9<br />
84